

Trend is one of the most fundamental concepts in technical analysis. By observing price highs, lows, and the direction of trendlines, you can make an initial assessment of whether the market is in an uptrend, a downtrend, or a sideways market.
1. What Is a Trend?
Price rarely moves continuously upward or downward in a straight line. Uptrends include pullbacks, while downtrends also include rebounds.
Therefore, trend analysis should not focus only on short-term price moves. Instead, examine the structure of highs and lows formed over time.
Markets are generally grouped into three states:
• Uptrend
• Downtrend
• Sideways
2. Three Basic Market Trends
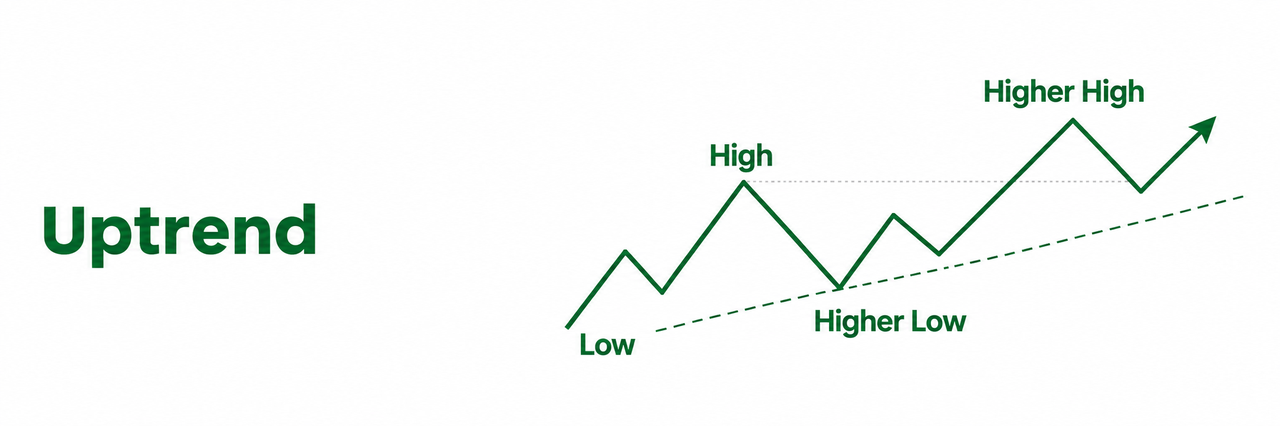
2.1 Uptrend
The typical structure of an uptrend is:
Higher Highs + Higher Lows
In other words, both highs and lows keep moving higher.
For example:
Low → High → Higher Low → Higher High
As long as price continues to form higher highs and higher lows, the overall bullish structure generally remains intact.
Therefore, a pullback within an uptrend does not necessarily mean the trend has reversed. More importantly, observe:
Whether the low after the pullback remains above the previous low.
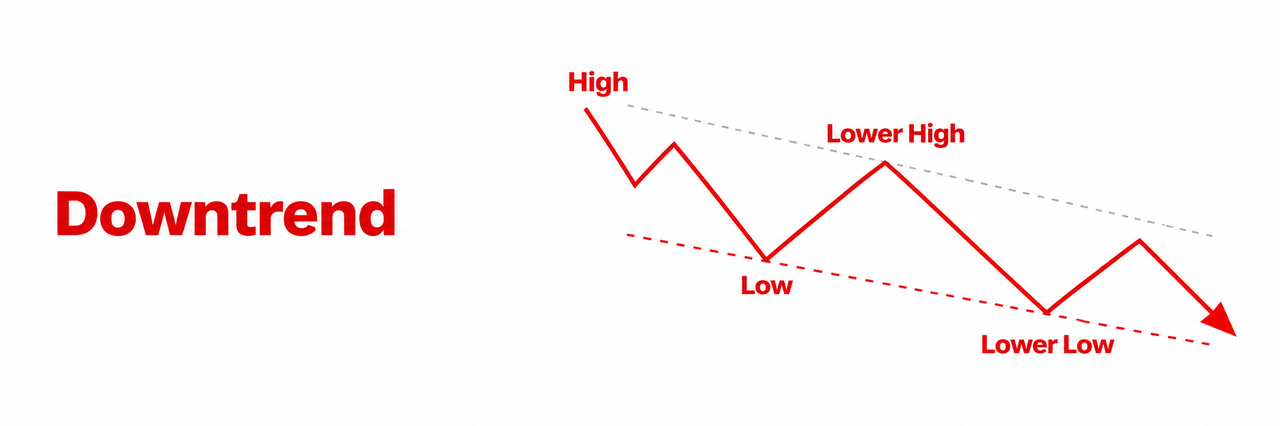
2.2 Downtrend
The typical structure of a downtrend is:
Lower Highs + Lower Lows
In other words, both highs and lows keep moving lower.
For example:
High → Low → Lower High → Lower Low
Even if rebounds occur along the way, as long as the rebound high remains below the previous high and price continues to form lower lows, the overall bearish structure generally remains intact.
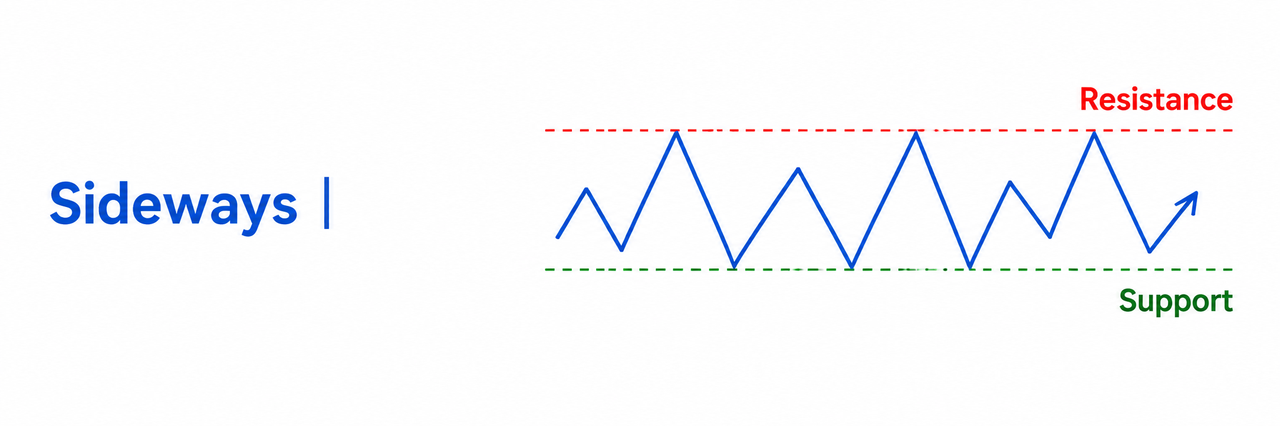
2.3 Sideways
When the market has no clear upward or downward direction and price repeatedly fluctuates within a range, it is commonly described as:
Sideways / Range-bound Market
Price often trades between:
Resistance and Support.
A sideways market is characterized by highs and lows that do not form a sustained upward or downward structure. The key is usually to observe whether price remains within the range.
3. How to Identify a Trend Using Highs and Lows
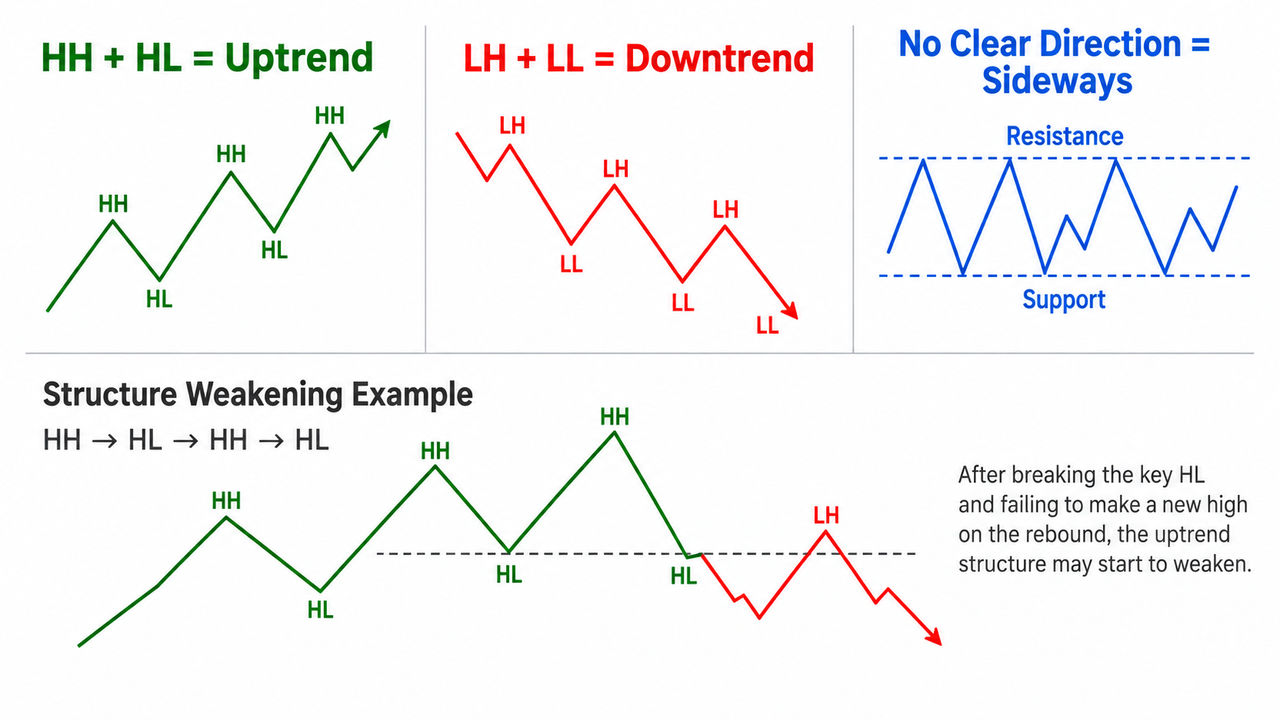
When identifying a trend, start by observing clear swing highs and swing lows.
Common abbreviations include:
• HH — Higher High
• HL — Higher Low
• LH — Lower High
• LL — Lower Low
A simple way to remember:
HH + HL = Uptrend
LH + LL = Downtrend
No Clear Direction = Sideways
For example, an uptrend may initially form:
HH → HL → HH → HL
If price then breaks below an important HL and fails to make a new high after rebounding, the previous bullish structure may begin to weaken.
Therefore, the core of trend analysis is not predicting the next candlestick, but observing:
Whether the price structure is still maintaining its original direction.
4. How to Use Trendlines
A trendline can help us observe market direction more intuitively.
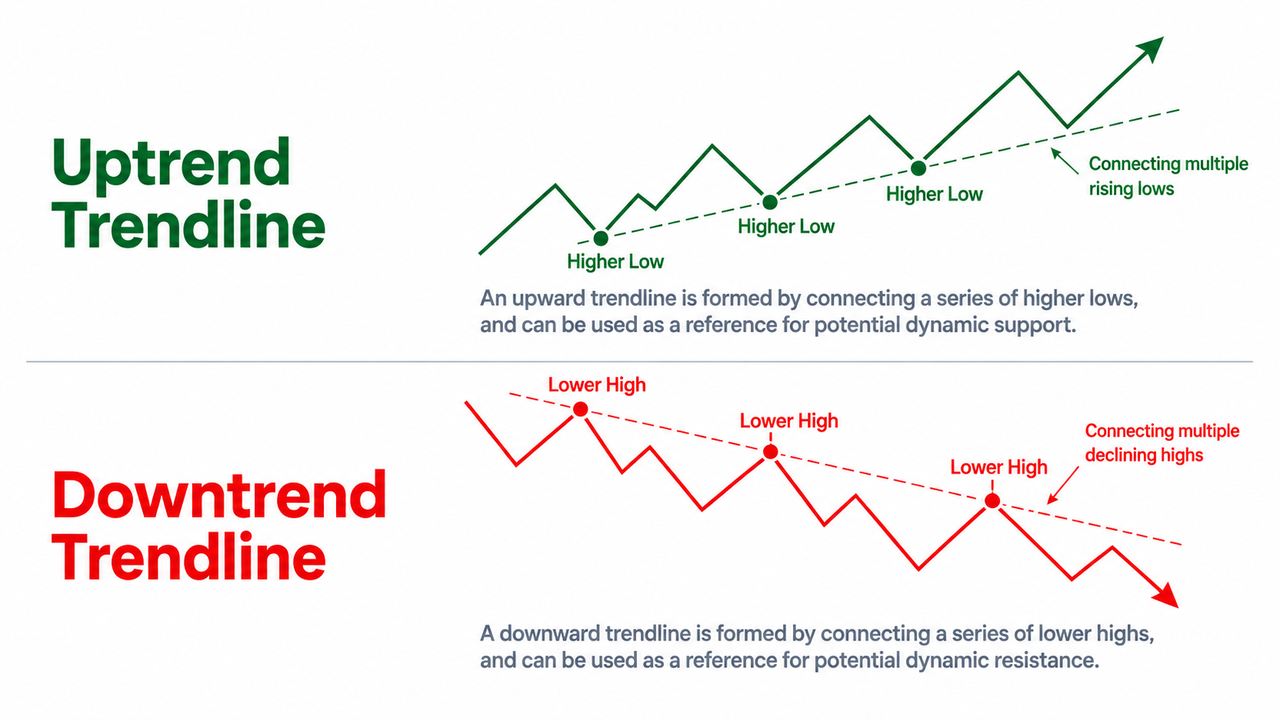
4.1 Uptrend Line
In an uptrend, you can connect multiple progressively higher lows:
Higher Low → Higher Low → Higher Low
This creates an upward-sloping trendline that can serve as a reference for potential dynamic support.
4.2 Downtrend Line
In a downtrend, you can connect multiple progressively lower highs:
Lower High → Lower High → Lower High
This creates a downward-sloping trendline that can serve as a reference for potential dynamic resistance.
Generally, the more valid touches a trendline receives from price, the more meaningful it becomes as a reference.
5. Does a Trendline Break Mean a Trend Reversal?
Not necessarily.
A trendline break only indicates that the previous rhythm of price movement may be changing. By itself, it does not confirm that the trend has reversed.
For example, price may briefly break below an uptrend line and then quickly move back above it. This may be a:
False Breakout
Therefore, changes in trend should also be evaluated together with the structure of highs and lows.
If an uptrend shows all of the following at the same time:
• A break below the trendline
• A break below an important Higher Low
• A rebound that fails to make a new high
• Price begins to form a Lower High
Then the signs of trend weakening generally become more evident.
A simple way to remember:
Trendlines are supporting tools; price structure is the core.
6. Trends Can Differ Across Timeframes
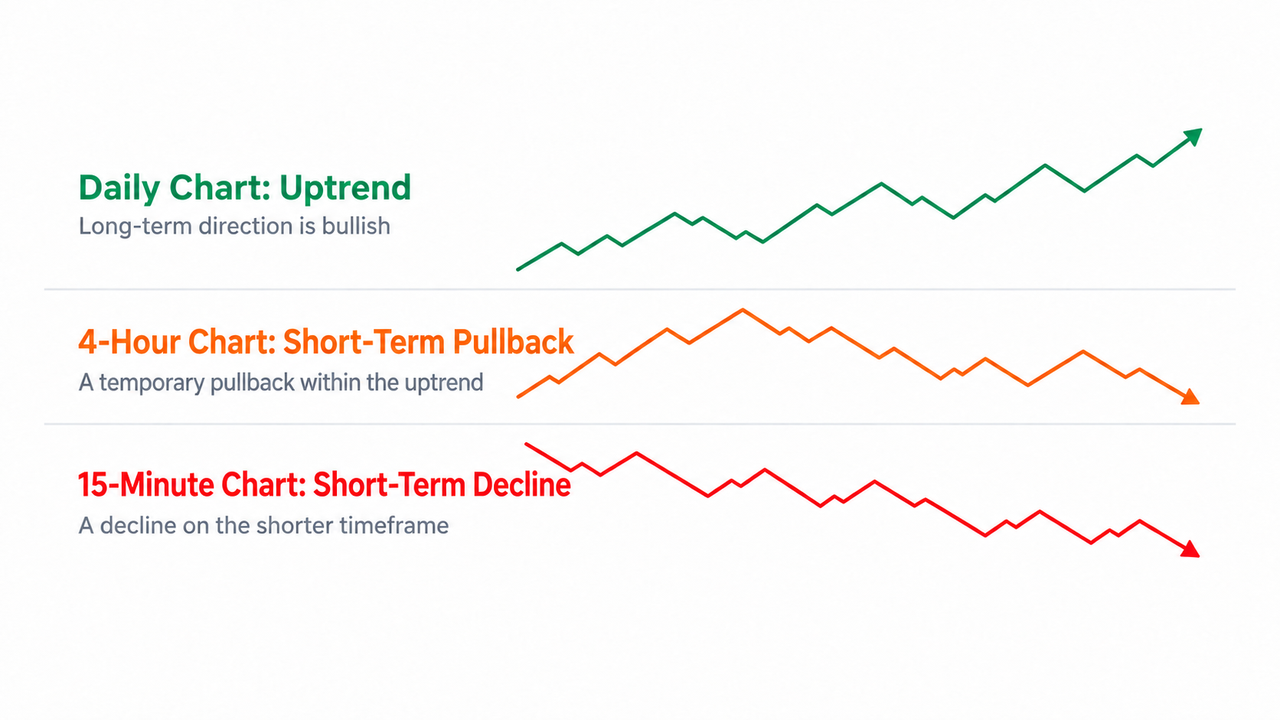
The same asset may show different trends at the same time across different timeframes.
For example:
• Daily chart: Uptrend
• 4-hour chart: Short-term pullback
• 15-minute chart: Short-term downtrend
These situations are not contradictory.
Therefore, before identifying a trend, first define the timeframe you are analyzing. Longer-term traders may focus more on daily or weekly charts, while short-term traders may focus more on hourly or minute charts.
7. Common Mistakes When Identifying Trends
Looking at only one or two candlesticks
A single large bullish or bearish candlestick does not mean a trend has formed or reversed.
Treating a pullback as a trend reversal
Pullbacks in an uptrend and rebounds in a downtrend are common. The key question is whether the original price structure has been broken.
Forcing a trendline
A trendline should connect clear highs or lows rather than being repeatedly adjusted to fit a predetermined view.
Ignoring the timeframe
Different timeframes can show different trends, so define the timeframe before beginning the analysis.
8. Summary
To identify a trend, remember these three core structures:
Uptrend
Higher Highs + Higher Lows
Downtrend
Lower Highs + Lower Lows
Sideways
No Clear Direction
Trendlines can help you observe market direction, but:
Trendline Break ≠ Trend Reversal
What truly matters is whether the structure of highs and lows has changed.
When identifying a trend, ask yourself:
Are the highs moving higher or lower?
Are the lows moving higher or lower?
Is the current structure still maintaining its original direction?
Understanding trends is an important foundation for further study of support and resistance, trend reversals, and price action analysis.
For educational purposes only. Not investment advice.