
Whether you trade stocks, cryptocurrencies, or other financial assets, one of the most common charts you will see on a market screen is the candlestick chart. The red and green bars constantly change and may look complicated at first, but the basic principles of candlesticks are actually quite simple. Every candlestick essentially answers one question: What happened to the price during this period? Understanding candlesticks is the first step toward reading trading charts and learning technical analysis.
1. What Is a Candlestick?
A candlestick is a charting method used to show how the price of an asset changes over a specific time period.
A complete candlestick contains four key prices:
① Open: the price at the beginning of the period
② High: the highest price reached during the period
③ Low: the lowest price reached during the period
④ Close: the price at the end of the period
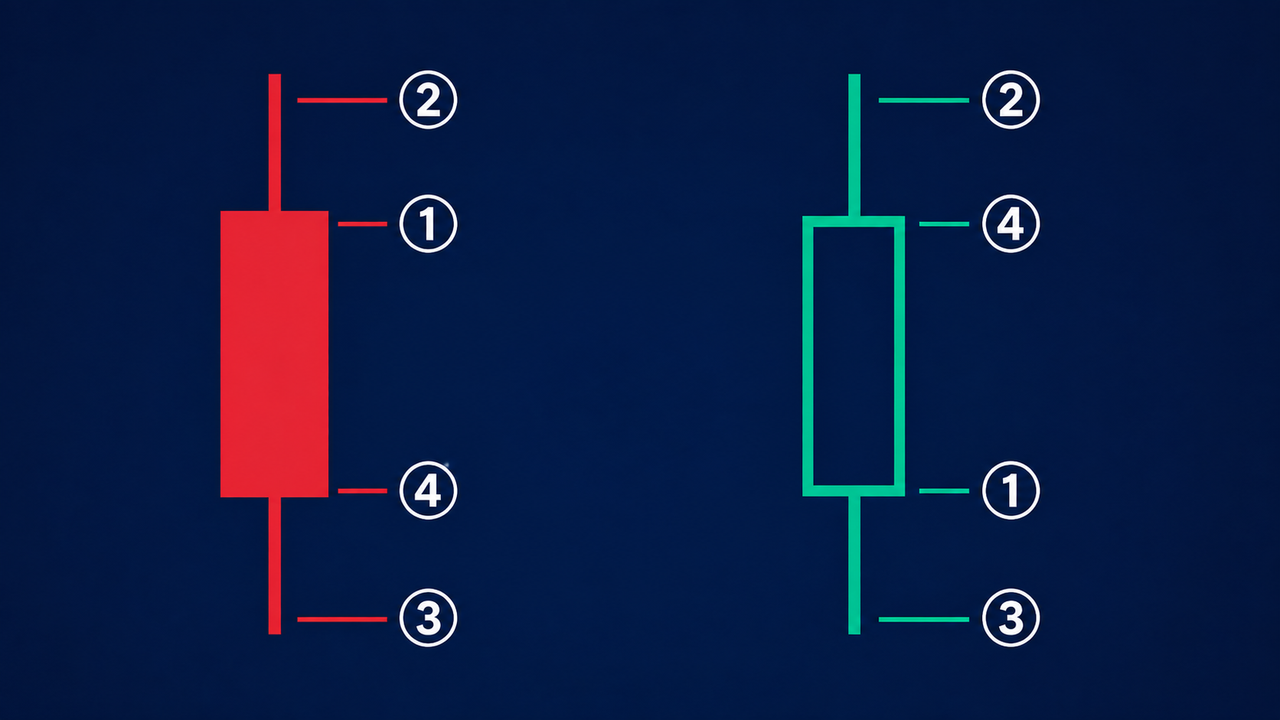
These four prices are commonly abbreviated as:
OHLC = Open + High + Low + Close
For example, on a 1-hour candlestick chart, each candlestick represents the open, high, low, and close during one hour.
On a 1-day chart, each candlestick represents the price movement during one trading day or the corresponding daily trading session.
Therefore, different timeframes can produce different candlestick structures for the same asset.
2. How Do You Read a Candlestick?
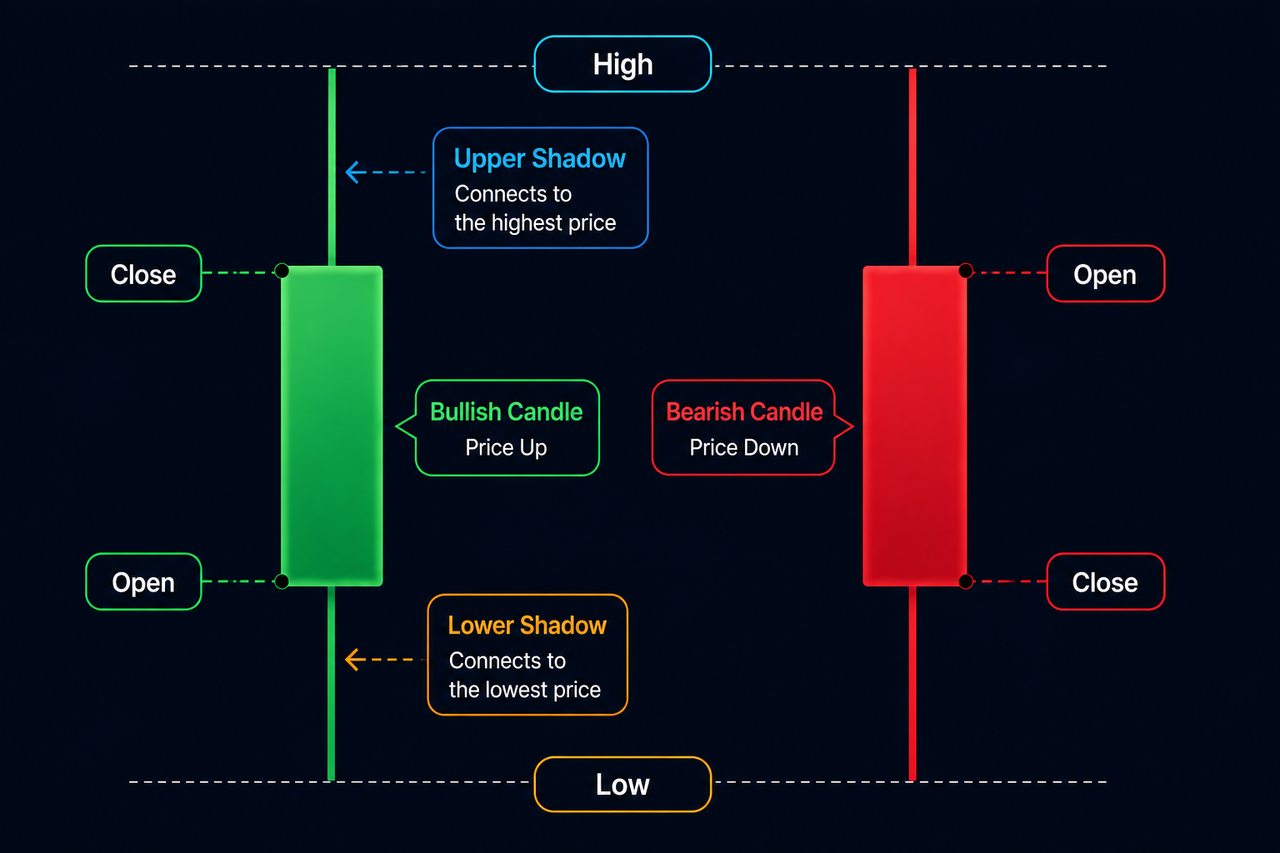
A candlestick mainly consists of two parts:
- Body
The thicker middle section of a candlestick is called the body.
It represents the price range between the open and the close.
If the close is higher than the open, the price rose overall during that period.
If the close is lower than the open, the price fell overall during that period. - Wick / Shadow
The thin lines above and below the body are called wicks or shadows.
The upper shadow extends to the highest price of the period.
The lower shadow extends to the lowest price of the period.
3. What Do Bullish and Bearish Candlesticks Mean?
Candlesticks can generally be divided into rising and falling candlesticks.
- Rising Candlestick
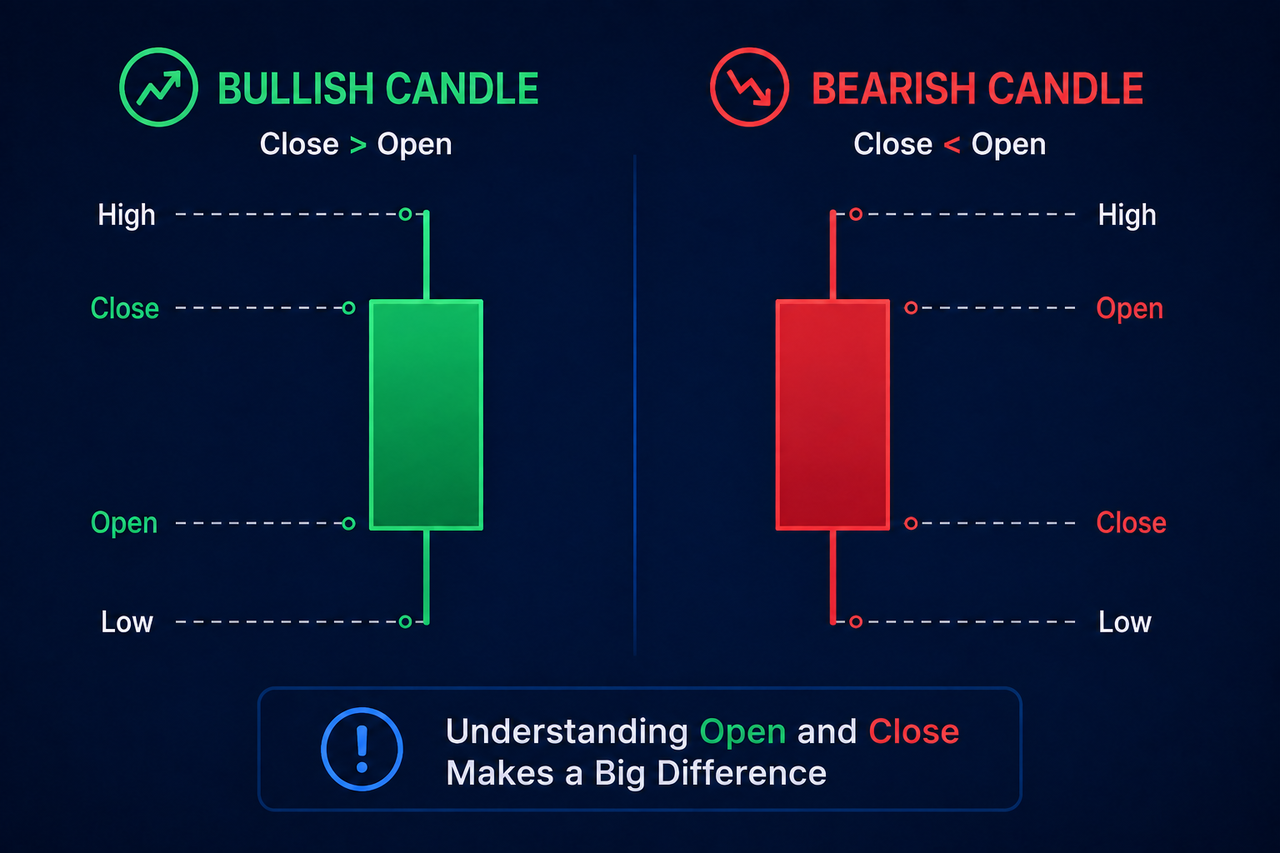
When Close > Open, meaning the closing price is higher than the opening price, the price rose during that period. - Falling Candlestick
When Close < Open, meaning the closing price is lower than the opening price, the price fell during that period.
Many trading platforms use green and red to distinguish them.
However, color conventions may differ across markets, platforms, and chart settings.
Rather than simply memorizing “green = up, red = down,” it is more important to understand which is higher: the Open or the Close.
4. What Can the Body and Shadows Tell Us?
Once you can identify OHLC, you can begin to observe candlestick shapes in more detail.
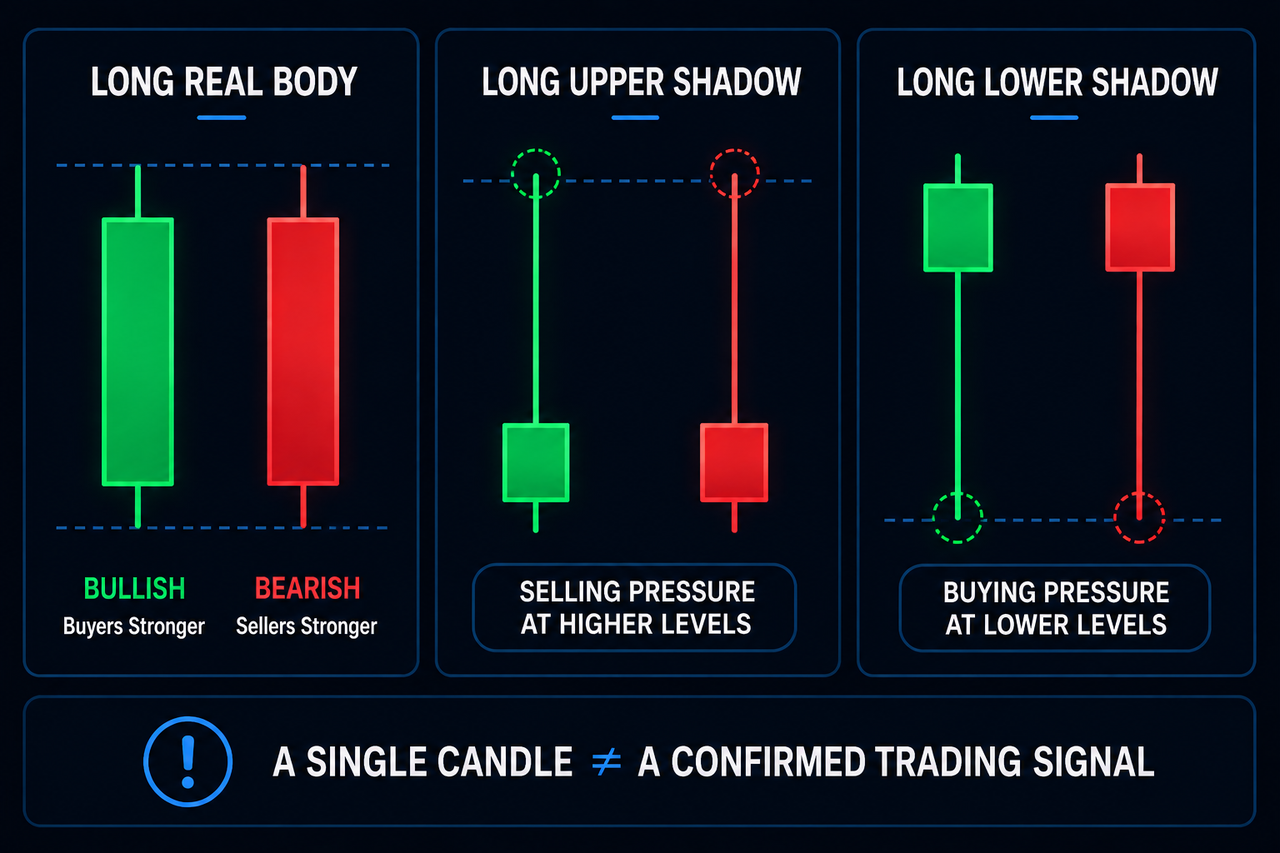
Long Real Body
If a candlestick has a noticeably long real body, the price moved significantly between the open and close during that period.
For example, a long rising candlestick may indicate relatively strong buying pressure, while a long falling candlestick may reflect stronger selling pressure.
Long Upper Shadow
A pronounced long upper shadow means the price moved to a higher level during the period but later pulled back. This may indicate some selling pressure at higher prices.
Long Lower Shadow
A pronounced long lower shadow means the price fell to a lower level during the period but later recovered. This may indicate some buying interest at lower prices.
Importantly, a single candlestick provides information about price action; it is not a confirmed trading signal.
A long upper shadow does not guarantee that the price will fall, and a long lower shadow does not guarantee that the price will rise.
5. Why Do Traders Use Candlestick Charts?
The main value of candlestick charts is that they turn complex price data into visual information that is easier to understand.
By observing multiple candlesticks in sequence, traders can assess:
• whether the overall price is rising or falling
• whether the market is moving sideways
• whether price volatility is expanding
• whether buyers or sellers are relatively dominant during certain periods
• which price areas have repeatedly seen rebounds or pullbacks
This information also forms a foundation for learning technical-analysis concepts such as trends, support, resistance, moving averages, and MACD.
6. How Do Candlesticks Differ Across Timeframes?
This is an important point that beginners often overlook.
Common candlestick timeframes include:
1m — 1 minute
5m — 5 minutes
15m — 15 minutes
1H — 1 hour
4H — 4 hours
1D — 1 day
1W — 1 week
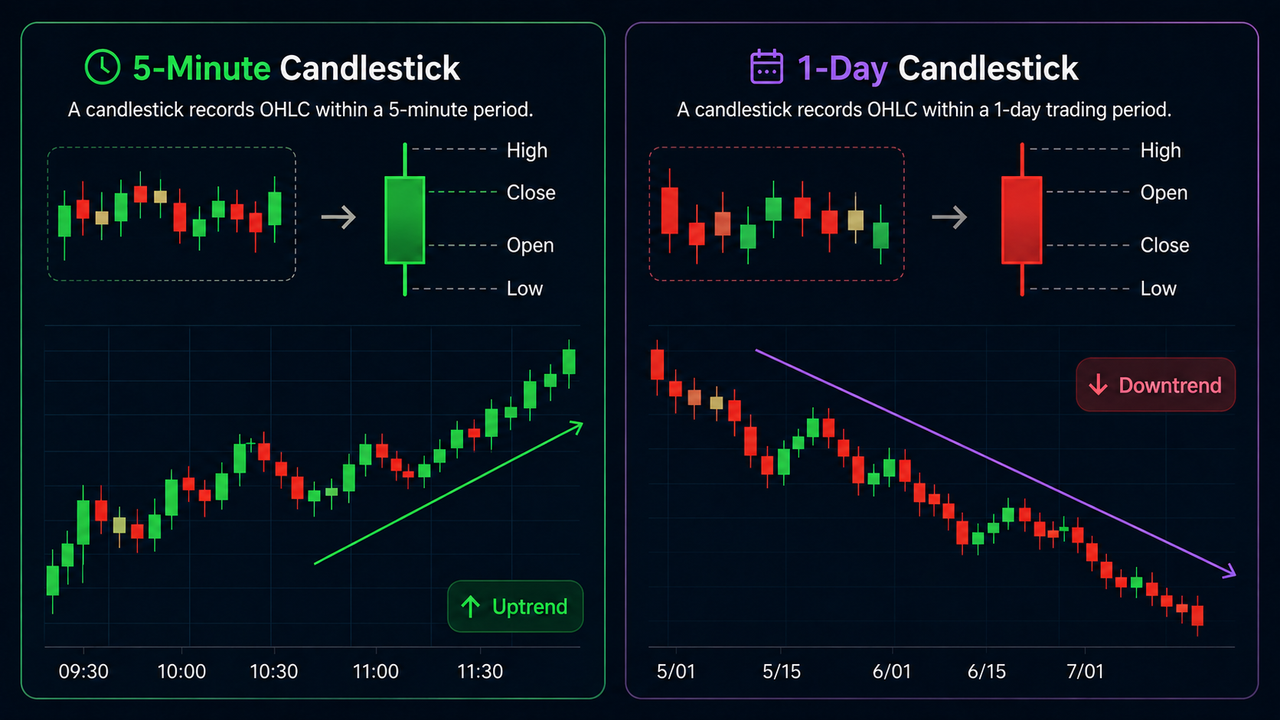
For example, a 5-minute candlestick records the OHLC during a five-minute period.
A 1-day candlestick records the OHLC during the corresponding trading session for one day.
As a result, the same asset may be rising on a 5-minute chart while still remaining within a larger downtrend on the daily chart.
This is why traders generally do not rely on only one timeframe.
7. Three Common Beginner Mistakes When Reading Candlesticks
Mistake 1: Chasing the price immediately after seeing a large rising candlestick
A rising candlestick only shows that the price increased during the previous period. It does not guarantee that the next candlestick will continue to rise.
Mistake 2: Assuming a particular candlestick pattern will always work
No single candlestick pattern can predict future market movements with 100% certainty.
Technical analysis is fundamentally about studying market behavior and probabilities, not finding absolute answers.
Mistake 3: Looking only at candlesticks without considering market context
The same candlestick pattern can have very different meanings in an uptrend, a downtrend, or a sideways market.
A more complete analysis therefore usually combines:
Candlesticks + Trend + Support/Resistance + Volume + Technical Indicators.
8. One-Minute Summary: Candlesticks Are Easier Than They Look
If you are learning candlesticks for the first time, remember these key points:
① Each candlestick represents one time period
② Each candlestick contains Open, High, Low, and Close
③ The body represents the area between the opening and closing prices
④ The shadows represent the high and low prices reached during the period
⑤ Candlesticks reflect price action that has already occurred; they do not guarantee future prices
The most important formula is:
K Line / Candlestick = Open + High + Low + Close
Once you understand these four prices, you have already taken the first step toward reading trading charts.
Disclaimer: This content is for educational purposes only and does not constitute financial or investment advice. Trading involves risk. Please make independent investment decisions based on your own circumstances and risk tolerance.