
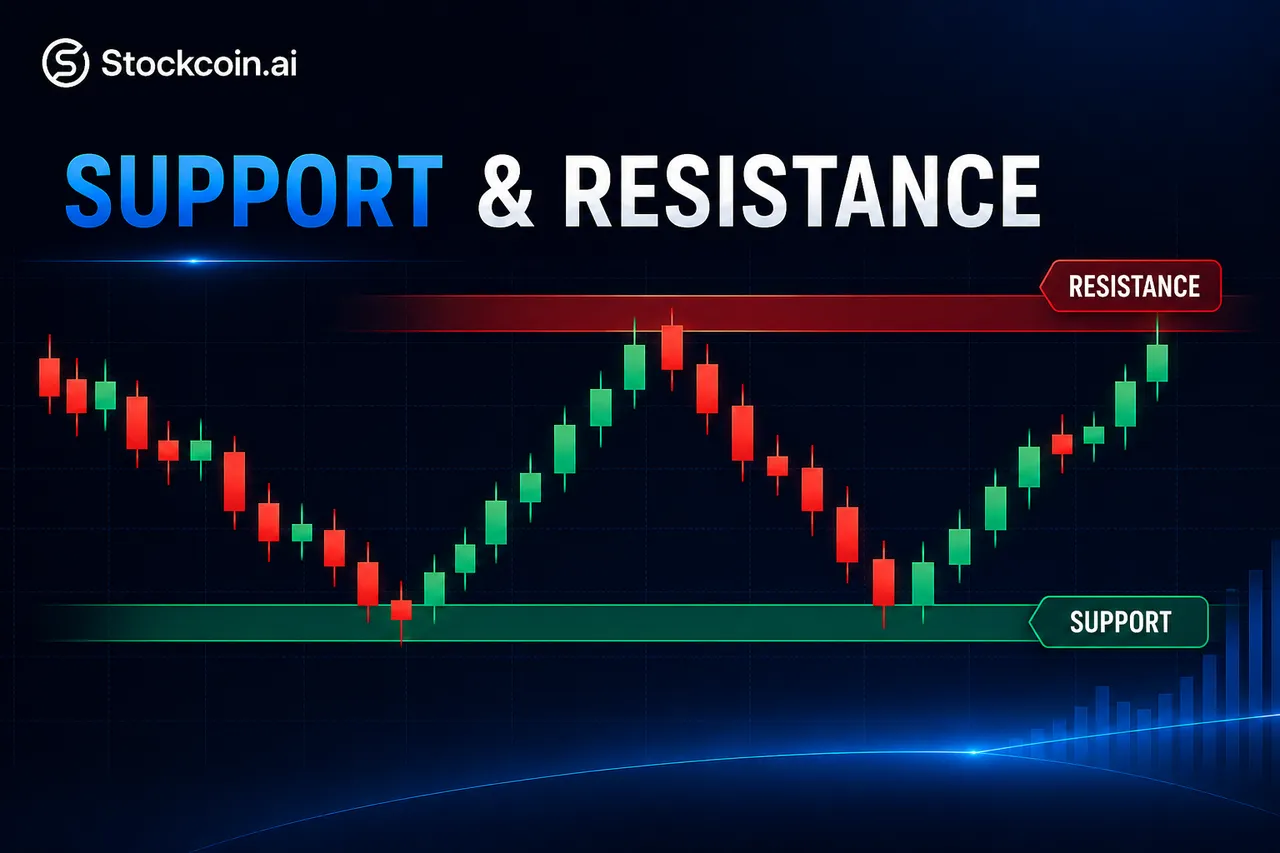
When looking at price charts for stocks, cryptocurrencies, or other financial assets, you may notice something: Prices do not simply keep rising or falling. Instead, they often bounce, pause, or encounter pressure around certain areas. Why does price repeatedly react around these areas? Because there are important price zones that attract market attention. These zones are commonly known in trading analysis as support and resistance. Understanding support and resistance can help traders better observe changes in buying and selling pressure.
1. What Is Support?
Support refers to:
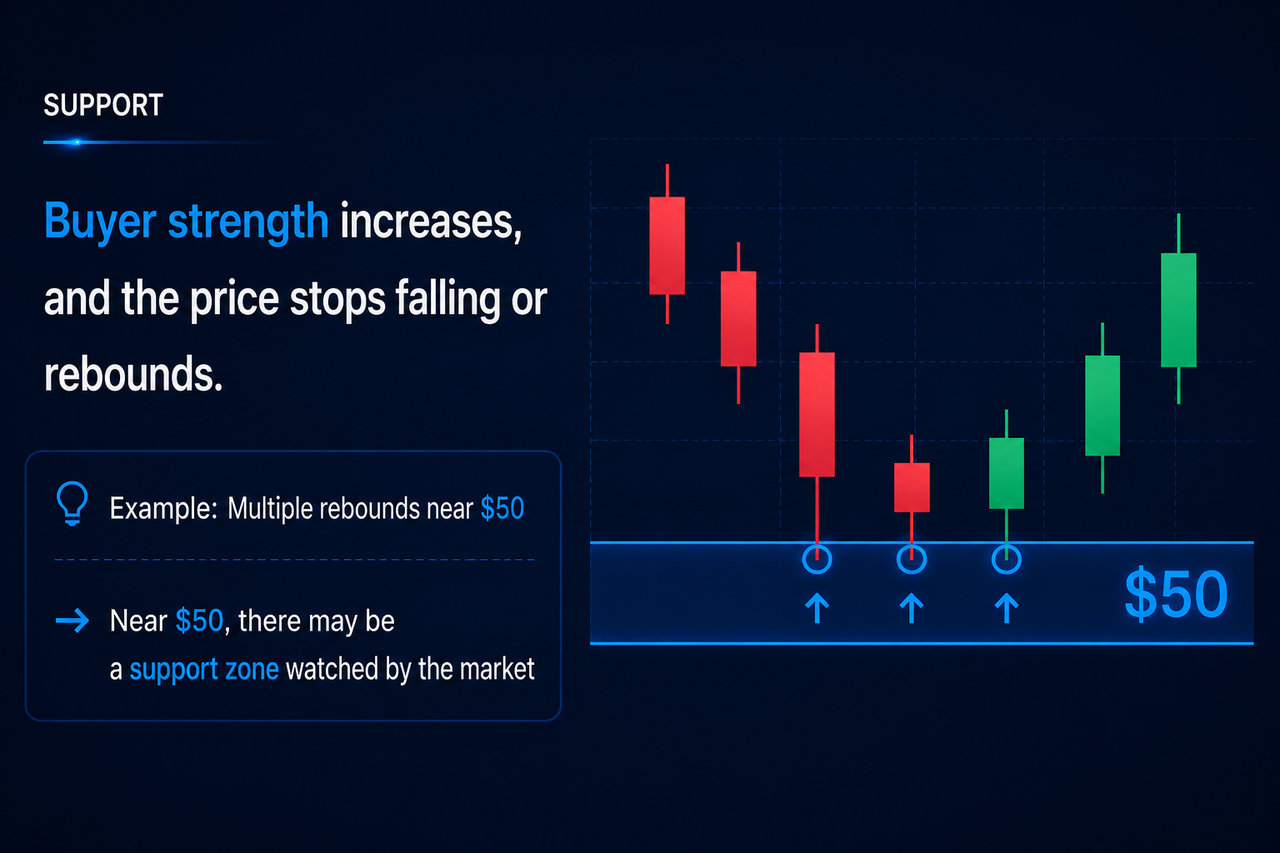
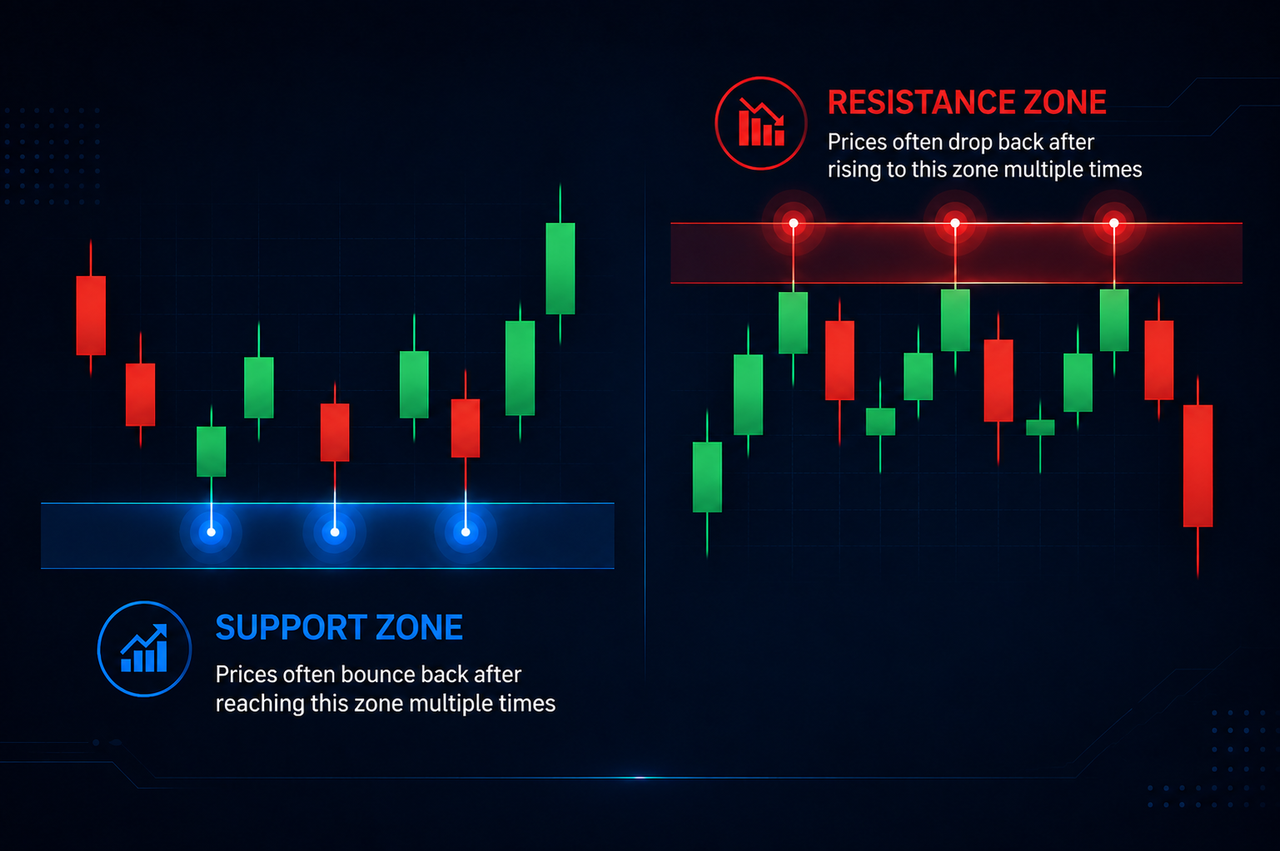
An area where buying pressure may increase as the price falls, potentially causing the decline to stop or the price to rebound.
Simply put, support represents relatively strong buying interest in the market.
When the price falls back toward a certain area:
- Some investors may consider the price attractive
- Buyers waiting on the sidelines may begin entering the market
- Buying pressure may gradually increase
As a result, the price may find support.
For example:
Suppose a stock has bounced several times around $50.
This does not mean that $50 is an absolutely precise support level.
Instead, it suggests that:
The area around $50 may be an important support zone watched by the market.
2. What Is Resistance?
Resistance refers to:
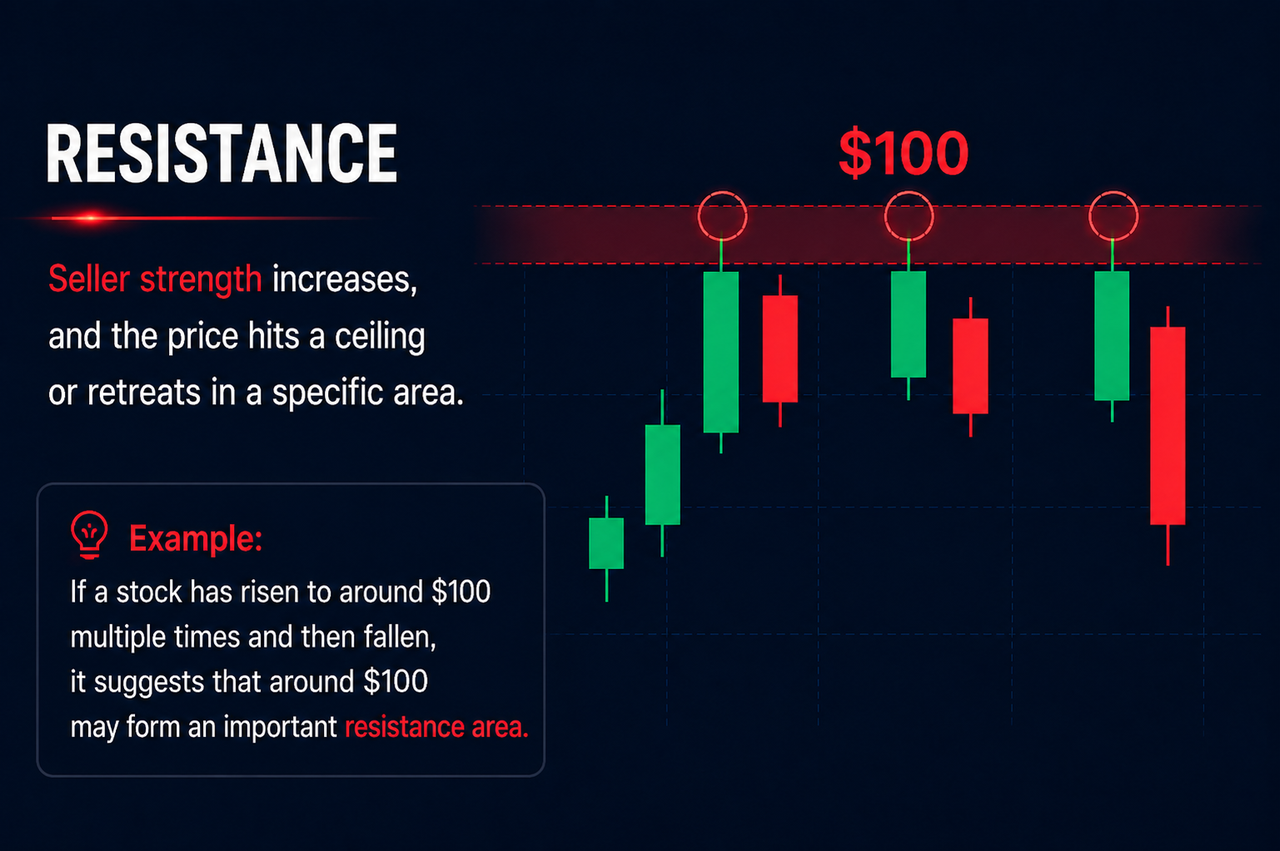
An area where selling pressure may increase as the price rises, potentially limiting further gains or causing the price to pull back.
Simply put, resistance represents relatively strong selling pressure in the market.
When the price rises toward a certain area:
- Some investors may choose to take profits
- The market may view the price as temporarily high
- Selling pressure may begin to increase
As a result, the price may encounter resistance.
For example:
Suppose a stock has repeatedly risen toward $100 and then pulled back.
This suggests that the area around $100 may have formed an important resistance zone.
3. Support and Resistance Should Be Viewed as “Zones”
Many beginners tend to think:
Support is one fixed price, and resistance is also one fixed price.
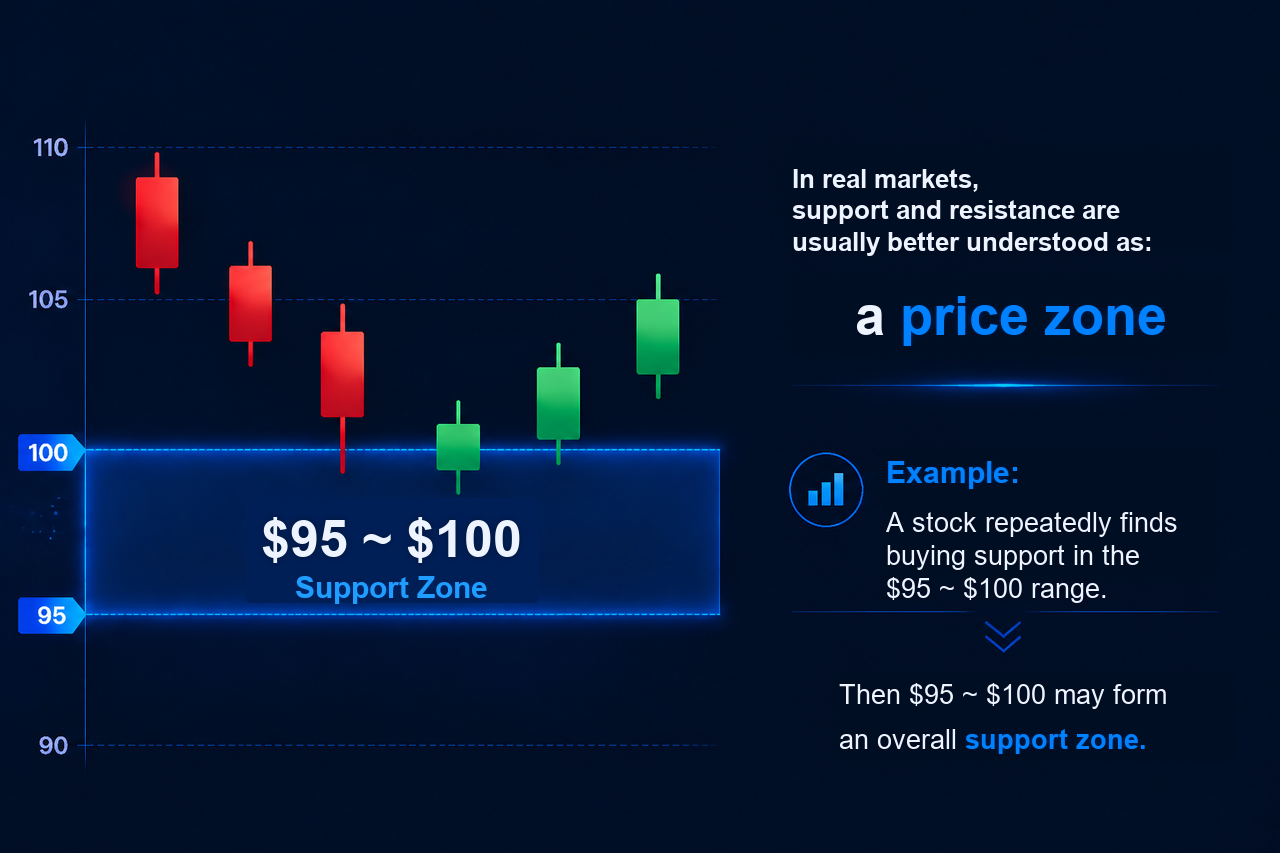
However, in real markets, support and resistance are usually better understood as:
Price zones rather than exact numbers.
This is because market participants do not all make trading decisions at exactly the same price.
For example:
Suppose a stock has repeatedly attracted buying interest between $95 and $100.
In that case, the entire $95–$100 range may act as a support zone rather than only one specific price.
Therefore:
What matters is not one exact number, but how the market reacts after price enters the zone.
4. How Do Support and Resistance Form?
Support and resistance essentially come from the collective reactions of market participants to price.
If price has bounced from a certain area several times in the past:
Investors may remember that area and watch to see whether buying interest appears again when the price returns.
Similarly, if price has repeatedly risen to a certain area and then fallen:
The market may begin to view that area as having strong selling pressure.
These historical price reactions can cause certain areas to become important zones watched by the market.
5. Support and Resistance Reversal: An Important Change After a Breakout
One important market principle is:
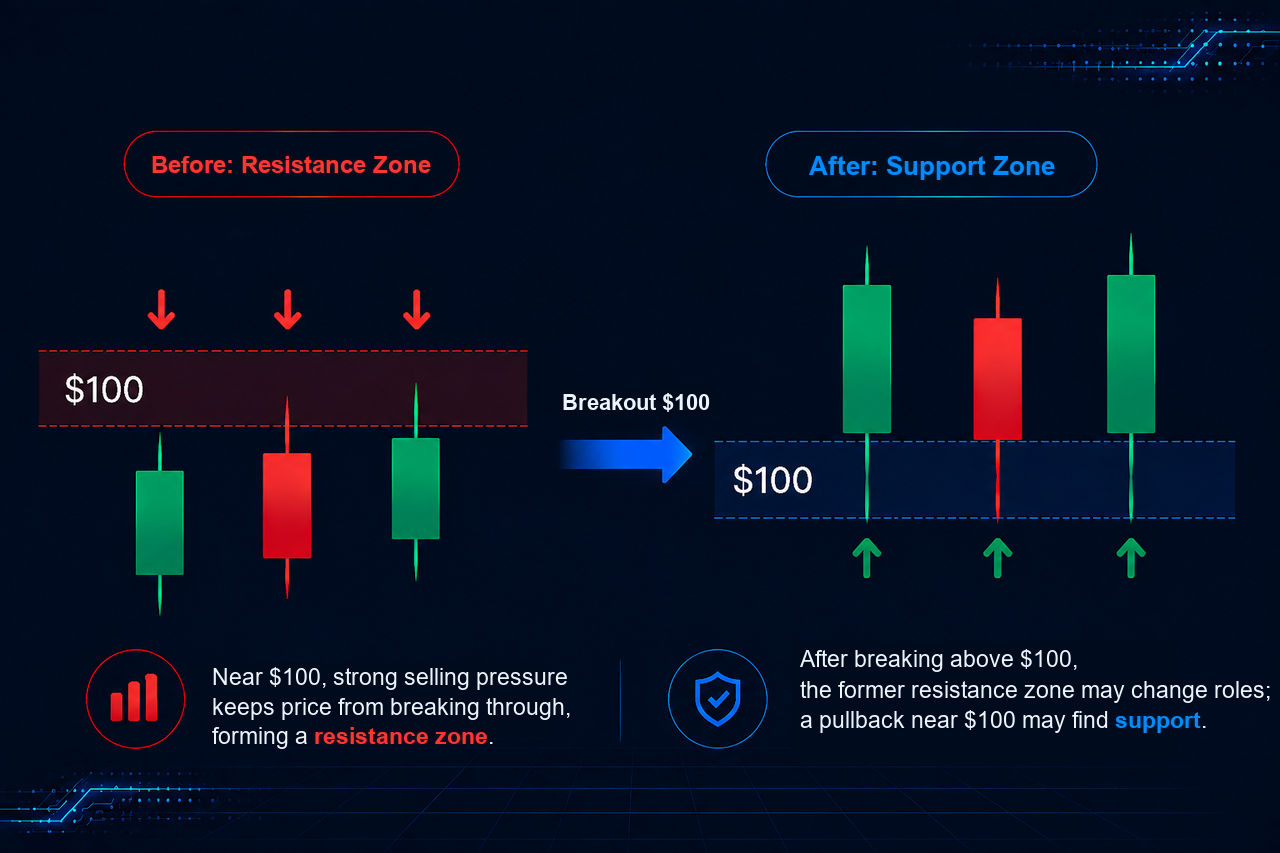
A resistance zone that has been broken may later become a new support zone.
For example:
Suppose a stock has struggled for a long time to break above $100.
Before the breakout, strong selling pressure around $100 makes it a resistance zone.
Once the price successfully breaks above $100:
The market’s perception of that area may change.
If the price later pulls back toward $100:
The former resistance zone may become a new support zone.
This is commonly known as:
Support and resistance reversal.
It reflects changes in market supply and demand and is an important reference point for many traders when evaluating trends.
6. How Can Traders Observe Support and Resistance?
Support and resistance are not tools for predicting price movements.
Instead, they help traders identify important areas to watch.
When price approaches a support zone, traders can observe:
- Whether signs of stabilization appear
- Whether buying pressure is increasing
- Whether trading volume changes
When price approaches a resistance zone, traders can observe:
- Whether price can break through effectively
- Whether the breakout is accepted by the market
- Whether the upward trend continues
7. Summary
Support and resistance are fundamental concepts for understanding market price behavior.
In simple terms:
📈 Support
→ An area where buying interest may appear as price falls
📉 Resistance
→ An area where selling pressure may appear as price rises
Traders should remember:
Support and resistance are not simply lines. They are price zones watched by the market.
The key is not to find one perfectly accurate price.
Instead, the important thing is to understand:
How buying and selling pressure change when price enters these key areas.
Understanding support and resistance can help traders interpret market movements more clearly and develop a more systematic approach to trading.
Disclaimer: This article is for educational and informational purposes only and does not constitute investment advice. Trading involves risk. Please make independent decisions based on your own circumstances.