
In financial markets, price tells us whether an asset is rising or falling, while trading volume reflects the level of trading activity behind those price movements. Why do some price rallies come with heavy trading volume, while other breakouts quickly reverse? Understanding trading volume can help us analyze market trends more comprehensively.
01 | What Is Trading Volume?
Trading volume refers to the quantity of an asset traded during a specific period. It is an important indicator of market trading activity.
For example, if 1 million shares of a stock are traded in a single day, its daily trading volume is 1 million shares.
Generally, higher volume indicates more active trading, while lower volume suggests relatively limited trading activity.
However, an increase in trading volume does not necessarily mean prices will rise. Volume measures trading activity, not price direction.
02 | Price-Volume Relationships: How Do They Work Together?
In technical analysis, trading volume is typically evaluated alongside price movements. There are four common price-volume patterns:
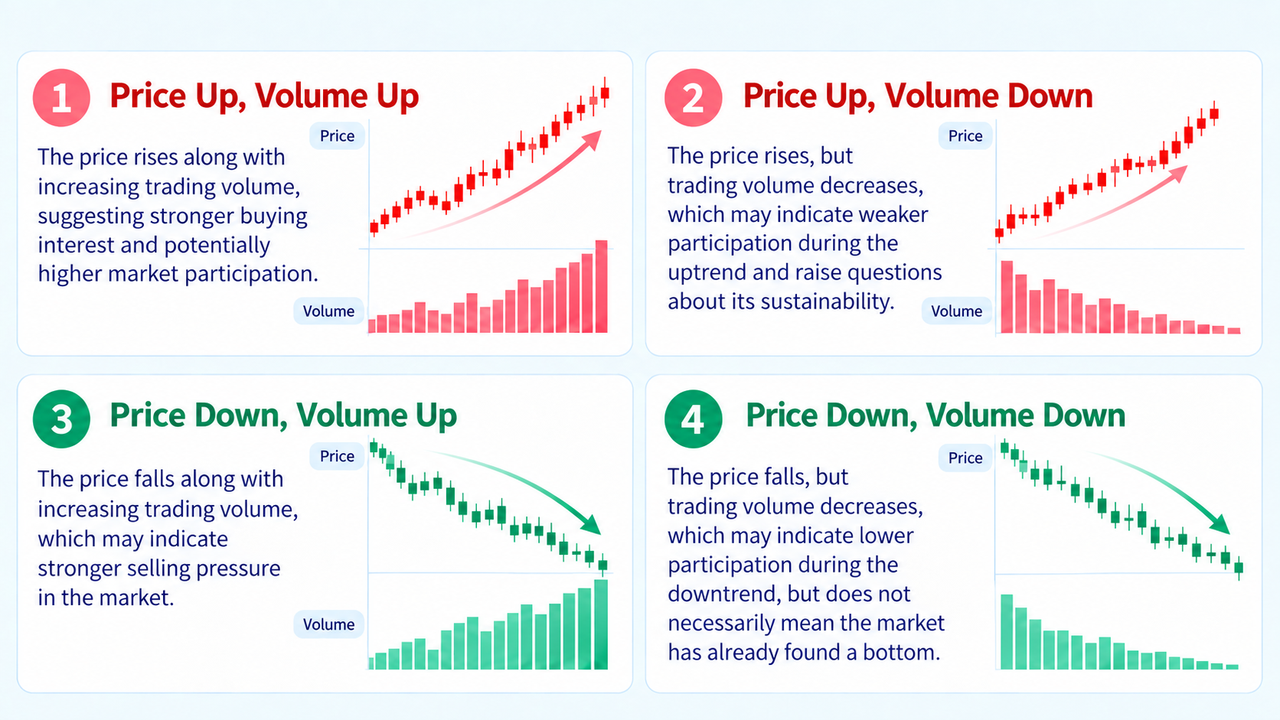
- Rising Price + Increasing Volume: Prices rise as trading volume increases, indicating more active trading and potentially greater market participation.
- Rising Price + Decreasing Volume: Prices rise while trading volume declines, potentially signaling reduced trading activity during the rally. Traders should pay attention to whether the trend can continue.
- Falling Price + Increasing Volume: Prices decline as trading volume increases, potentially indicating stronger selling pressure.
- Falling Price + Decreasing Volume: Prices decline while trading volume decreases, potentially suggesting reduced market participation during the downturn. However, this does not necessarily mean the market has reached a bottom.
Key Takeaway: Trading volume can help assess market participation behind a trend, but it should not be used as the sole basis for buying or selling decisions.
03 | Volume Expansion vs. Contraction: How to Measure Market Activity
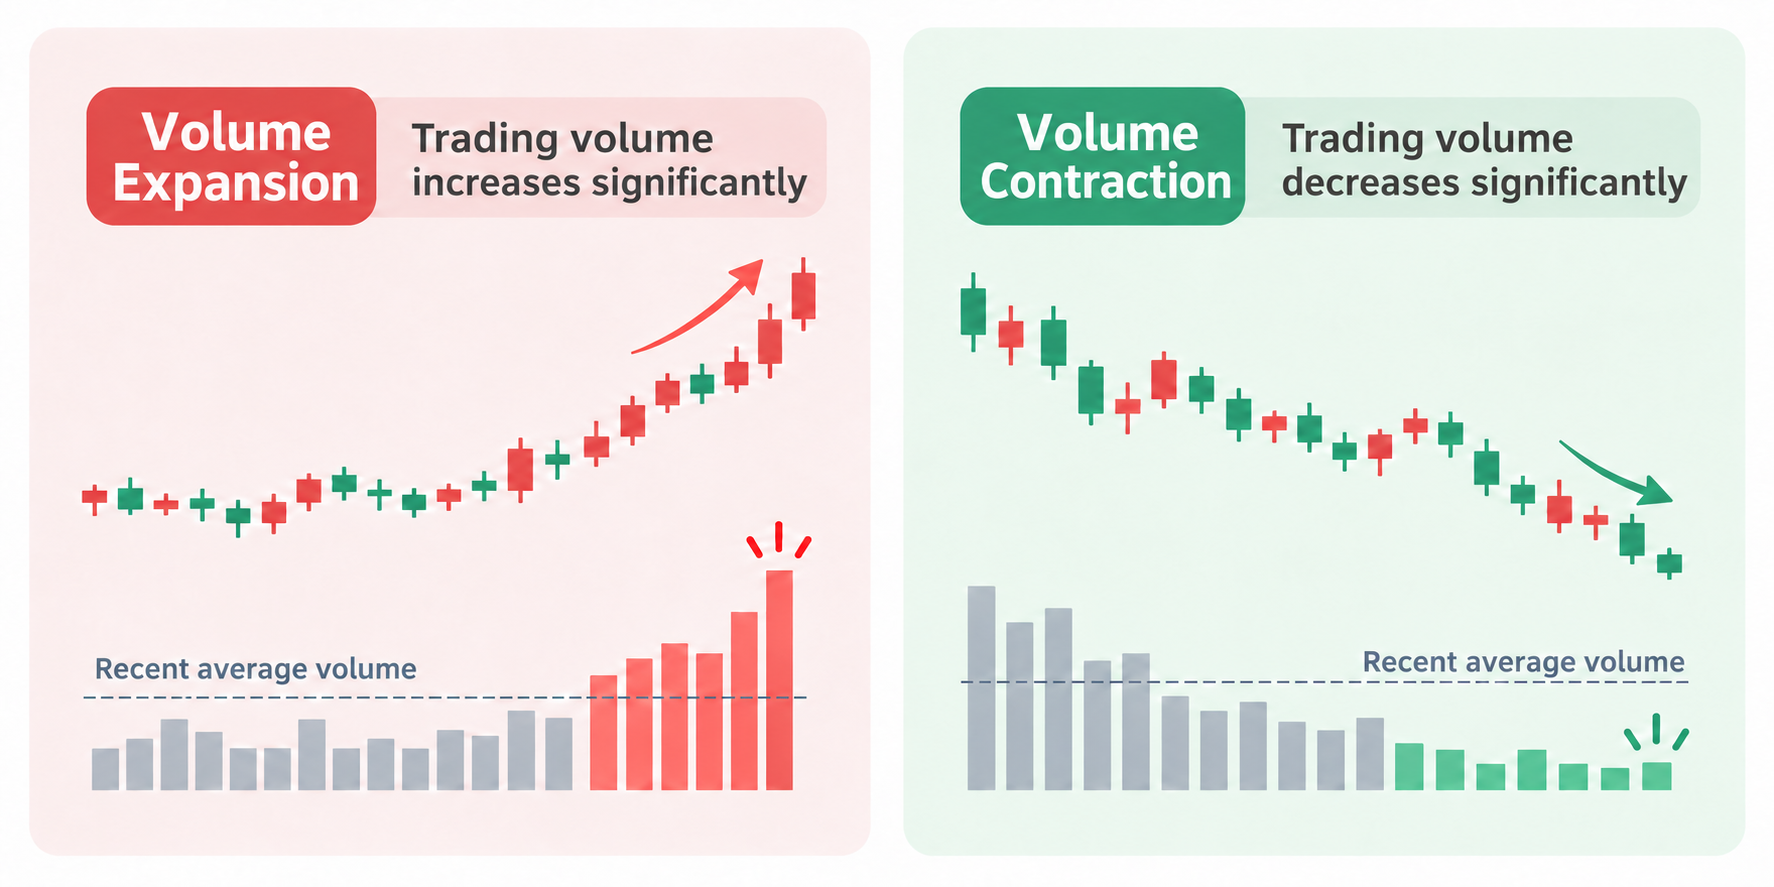
Volume Expansion: A Significant Increase in Trading Volume
Volume expansion occurs when current trading volume rises significantly above its recent average.
For example, if a stock's average daily trading volume over the past 20 trading days is 1 million shares, but today's volume reaches 2 million shares, this indicates a substantial increase in trading activity.
Volume expansion often occurs during price breakouts, major news announcements, or periods of heightened market volatility.
Volume Contraction: A Significant Decrease in Trading Volume
Volume contraction occurs when current trading volume falls significantly below its recent average.
It is commonly observed during sideways consolidation, periods when investors adopt a wait-and-see approach, or phases of declining market participation within an ongoing trend.
Importantly, volume expansion and contraction are relative concepts. Current volume should be compared with historical levels over the same timeframe.
04 | Breakout Confirmation: Why Does Volume Matter?
A breakout occurs when the price moves above an important resistance level or below a key support level.
However, not every breakout leads to a sustained price movement. Sometimes, prices quickly return to their previous trading range after a breakout. This is known as a false breakout.
Trading volume can provide additional context when evaluating the validity of a breakout:
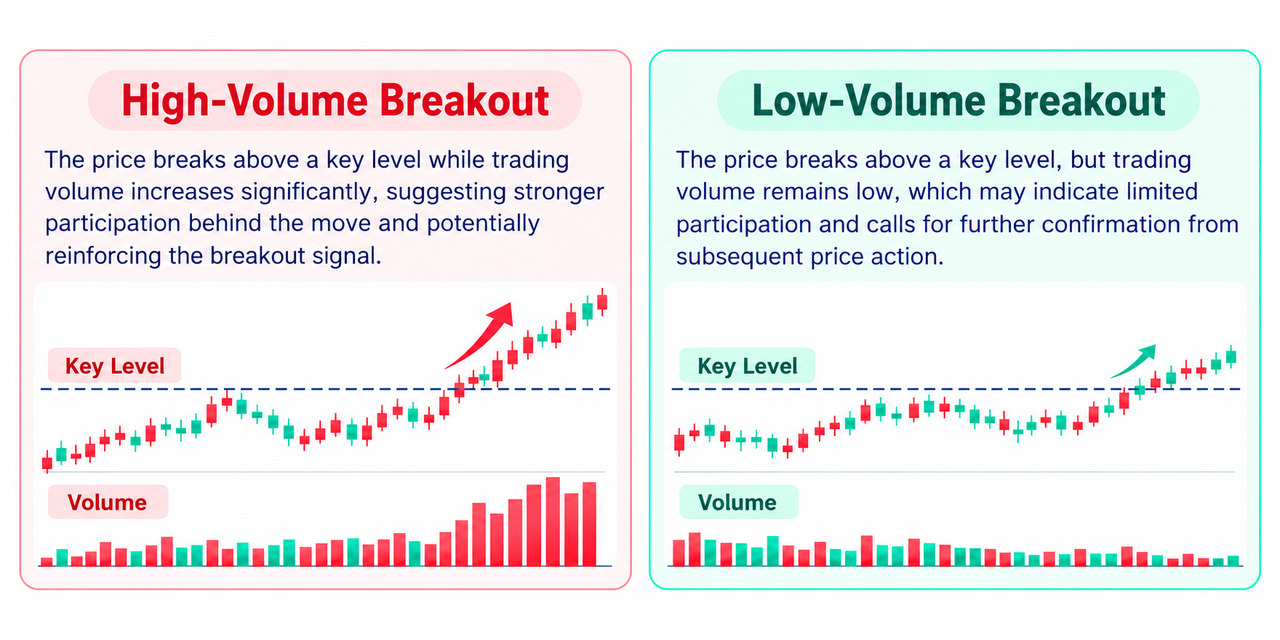
- High-Volume Breakout: Price breaks through a key level while trading volume increases significantly, suggesting greater market participation and potentially strengthening the supporting evidence for the breakout.
- Low-Volume Breakout: Price breaks through a key level with relatively low trading volume, suggesting limited market participation and the need to monitor subsequent price action.
For example, suppose a stock has repeatedly faced resistance around $50. If the price breaks above $50 while trading volume rises significantly above its recent average, the breakout is typically accompanied by more active trading.
However, a high-volume breakout is not guaranteed to succeed, just as a low-volume breakout is not necessarily destined to fail.
When evaluating a breakout, traders should also consider whether the price can hold above or below the key level and whether the subsequent price movement continues in the breakout direction.
05 | Conclusion: Price Shows Direction, Volume Shows Activity
Trading volume is one of the most fundamental indicators in technical analysis.
By monitoring volume changes alongside price trends, support levels, and resistance levels, traders can gain a more comprehensive understanding of market behavior.
Remember These Three Key Points:
- Increasing Volume ≠ Guaranteed Price Increase
- High-Volume Breakout ≠ Guaranteed Successful Breakout
- Trading Volume + Price Action = More Comprehensive Market Analysis
Price reflects market direction, while volume reveals the level of trading activity.
Understanding volume is not about predicting every price movement. It is about making more informed assessments of market trends.
Follow Stockcoin's Trading Basics series to keep learning essential trading concepts and develop a more systematic approach to market analysis!
Disclaimer: This article is intended for educational and informational purposes only and does not constitute investment advice. Trading financial assets involves risks. Please make decisions carefully based on your individual risk tolerance.