
When looking at charts, you will notice that candlesticks come in different shapes and sizes: some have long bodies, some have prominent wicks, while others have opening and closing prices that are almost identical. These different patterns all reflect the same thing: How buyers and sellers are competing during a certain period of time. In this episode, we will explore several common candlestick patterns and the market information they typically convey.
01|Understanding the Real Body and Wick
Before analyzing candlestick patterns, start by observing two key components:
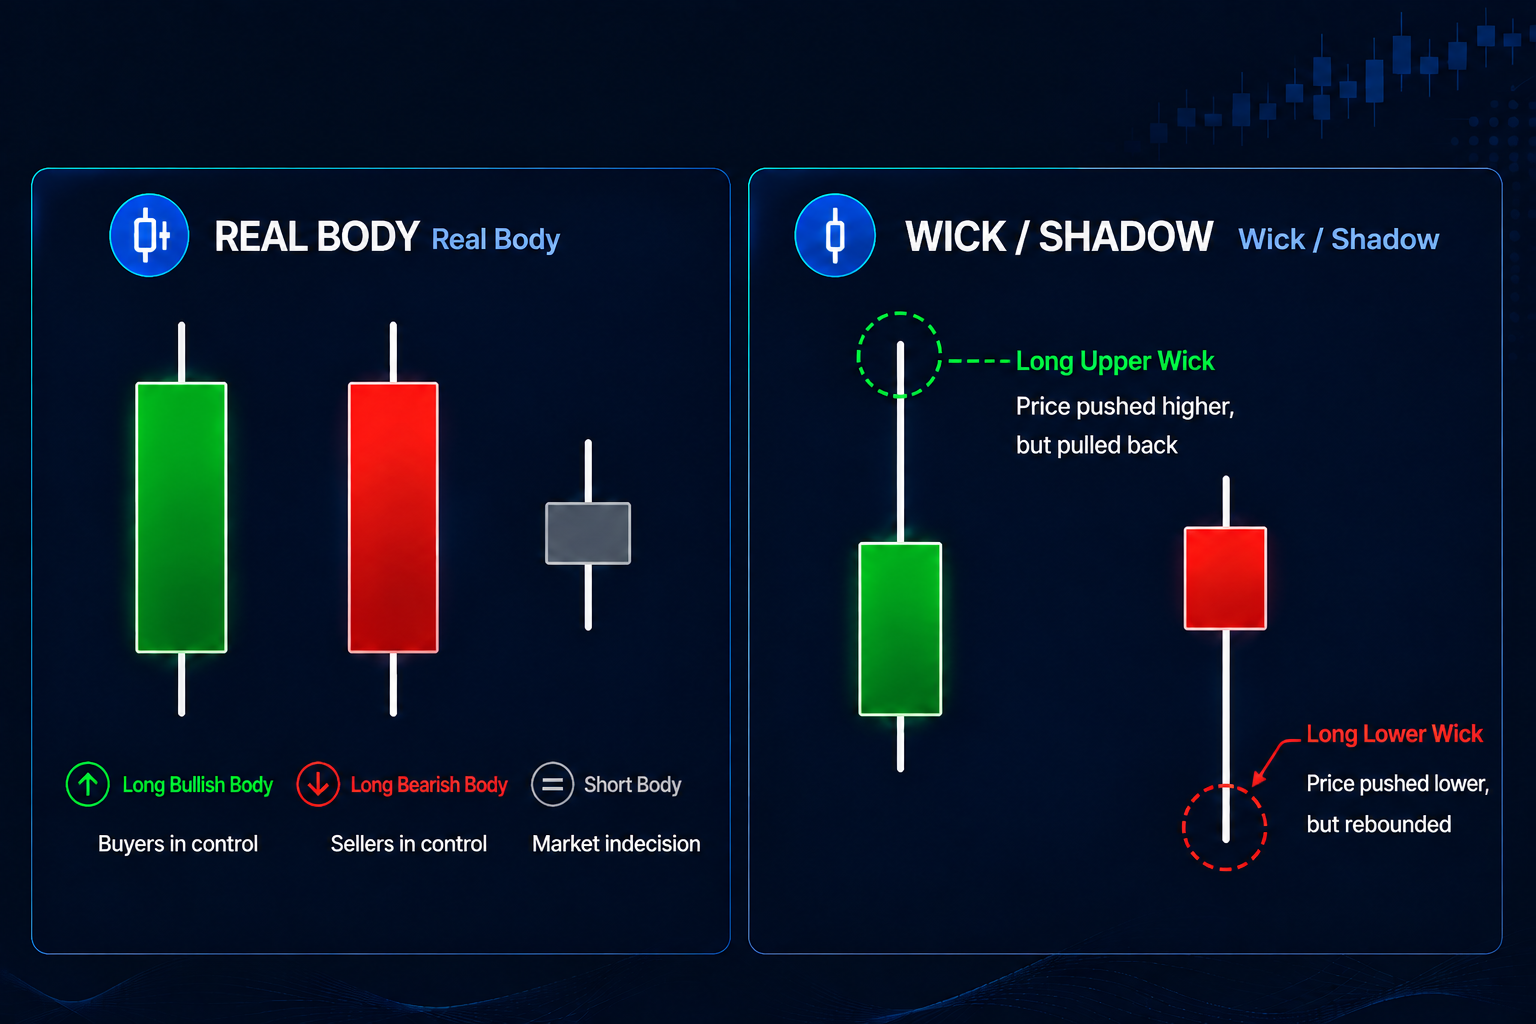
Real Body
The real body represents the price range between the opening price and the closing price.
Generally:
- Long bullish body: Buyers are relatively dominant during the period
- Long bearish body: Sellers are relatively dominant during the period
- Short body: Opening and closing prices are close, showing a temporary balance between buyers and sellers
The longer the real body, the more clearly the price has moved in one direction during that period.
Wick / Shadow
The wick records price levels that were reached during the period but were not maintained until the close.
- Long upper wick: Price moved significantly higher but later pulled back
- Long lower wick: Price declined significantly but later recovered
Therefore, wicks help us identify areas where prices encountered strong opposing forces.
02|Long Body Candles: Clear Market Direction
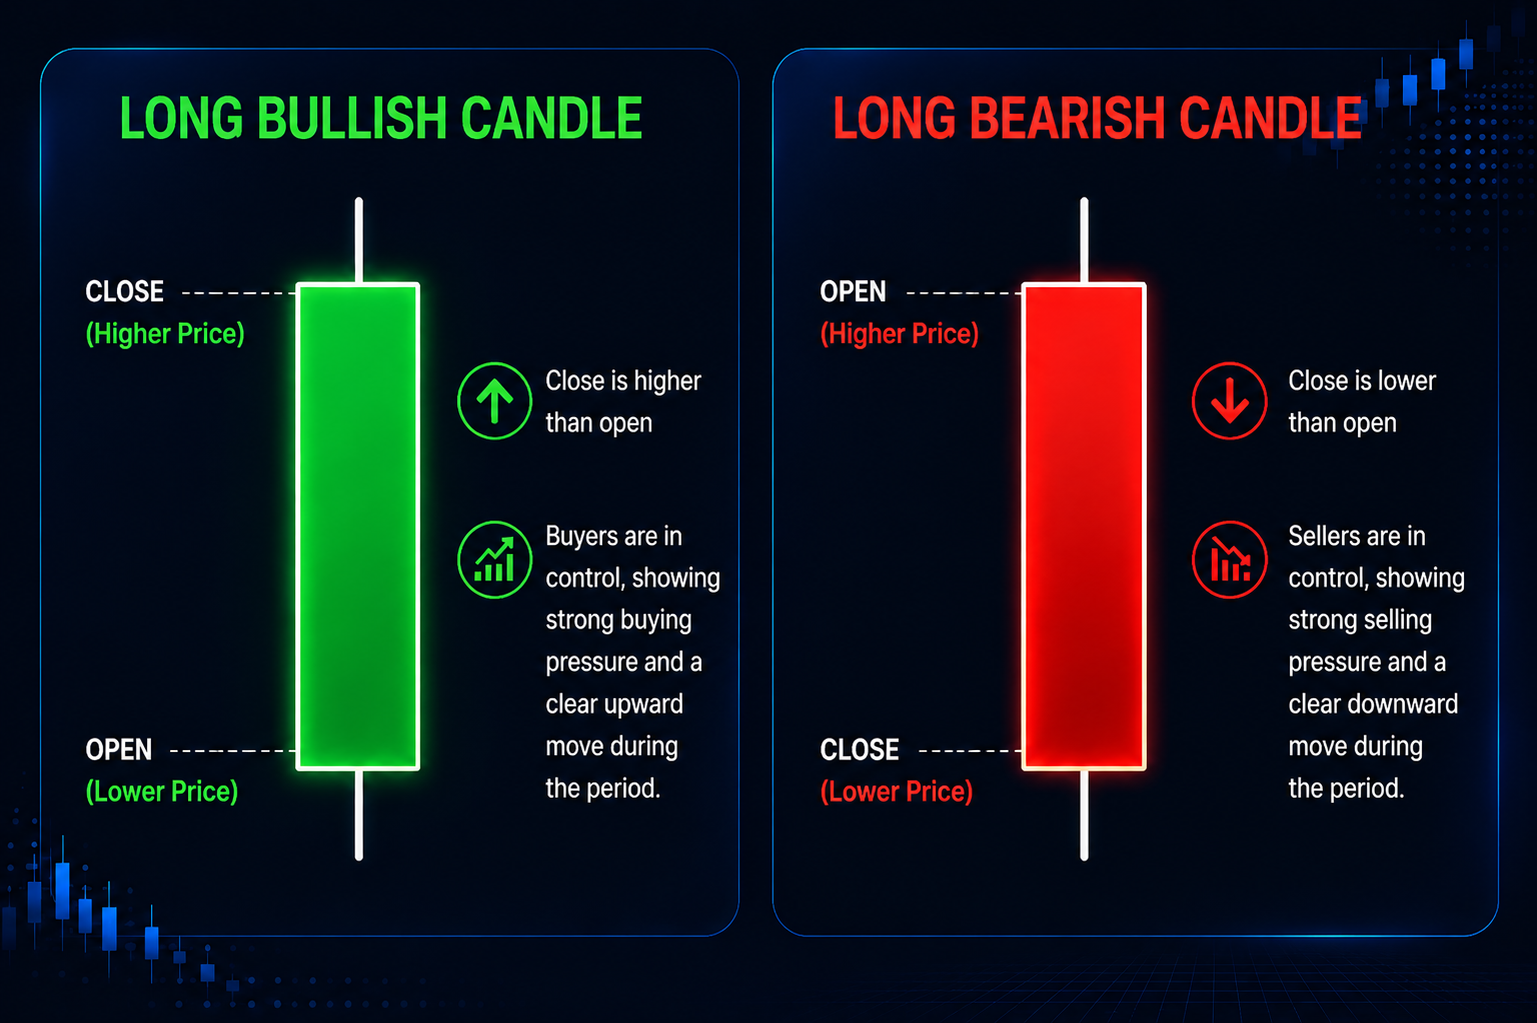
When a candlestick has a significantly long body, it usually indicates that one side has gained a clear advantage during that period.
Long Bullish Candle
The closing price is significantly higher than the opening price, usually indicating:
Strong buying pressure, with price rising significantly during the period.
Long Bearish Candle
The closing price is significantly lower than the opening price, usually indicating:
Strong selling pressure, with price declining significantly during the period.
However, a long body candle alone cannot confirm a future trend. It should be analyzed together with its position on the chart and subsequent price action.
03|Doji: Market Uncertainty Appears
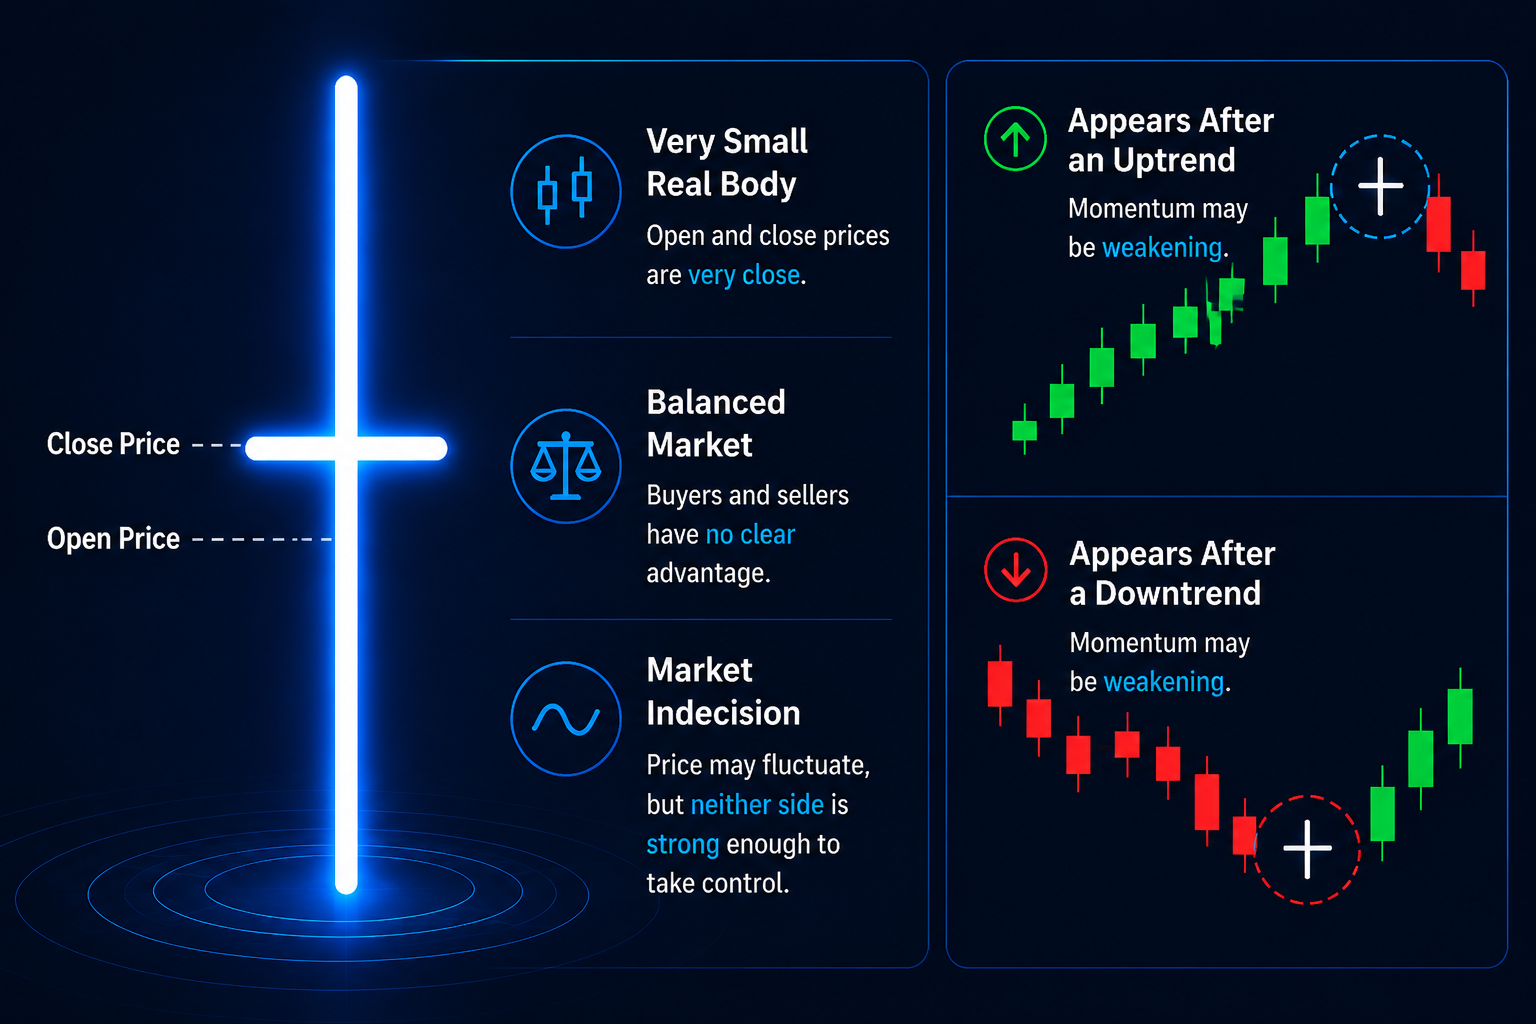
The key feature of a Doji is:
The opening price and closing price are very close, resulting in a very small body or even a nearly invisible body.
This means that although prices experienced volatility, neither buyers nor sellers gained a clear advantage by the close.
It can generally be interpreted as:
Market uncertainty, with buying and selling forces temporarily reaching balance.
The position where a Doji appears is especially important.
If it appears after a prolonged uptrend or downtrend, it may suggest that the momentum of the existing trend is weakening.
However:
Doji ≠ Guaranteed reversal.
Further confirmation from subsequent candlesticks is still required.
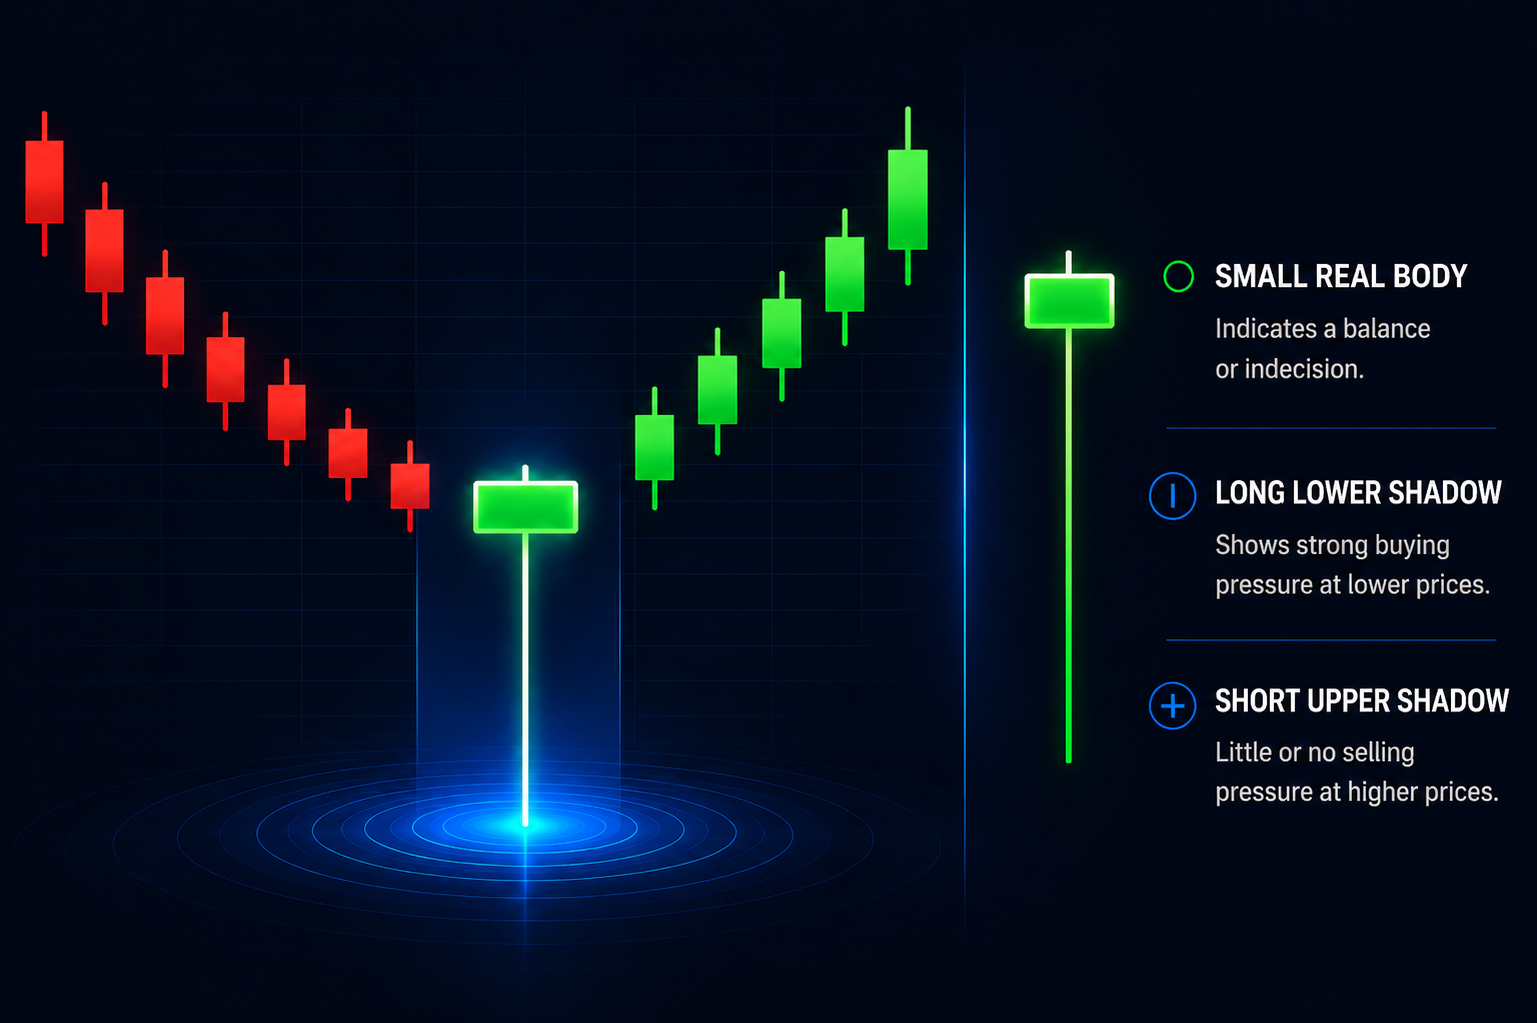
04|Hammer: Buying Pressure Appears at Lower Levels
A Hammer candlestick usually has the following characteristics:
- Small real body
- Long lower wick
- Short upper wick or no upper wick
It indicates that the price experienced a significant decline during the period but was later pushed back up by buyers.
Simply put:
Sellers were once in control, but stronger buying pressure appeared at lower levels.
When a Hammer appears after a downtrend, traders often pay attention to whether the market is showing potential signs of stabilization.
However:
Hammer ≠ Guaranteed upside.
Whether the price can continue strengthening afterward is the more important confirmation signal.
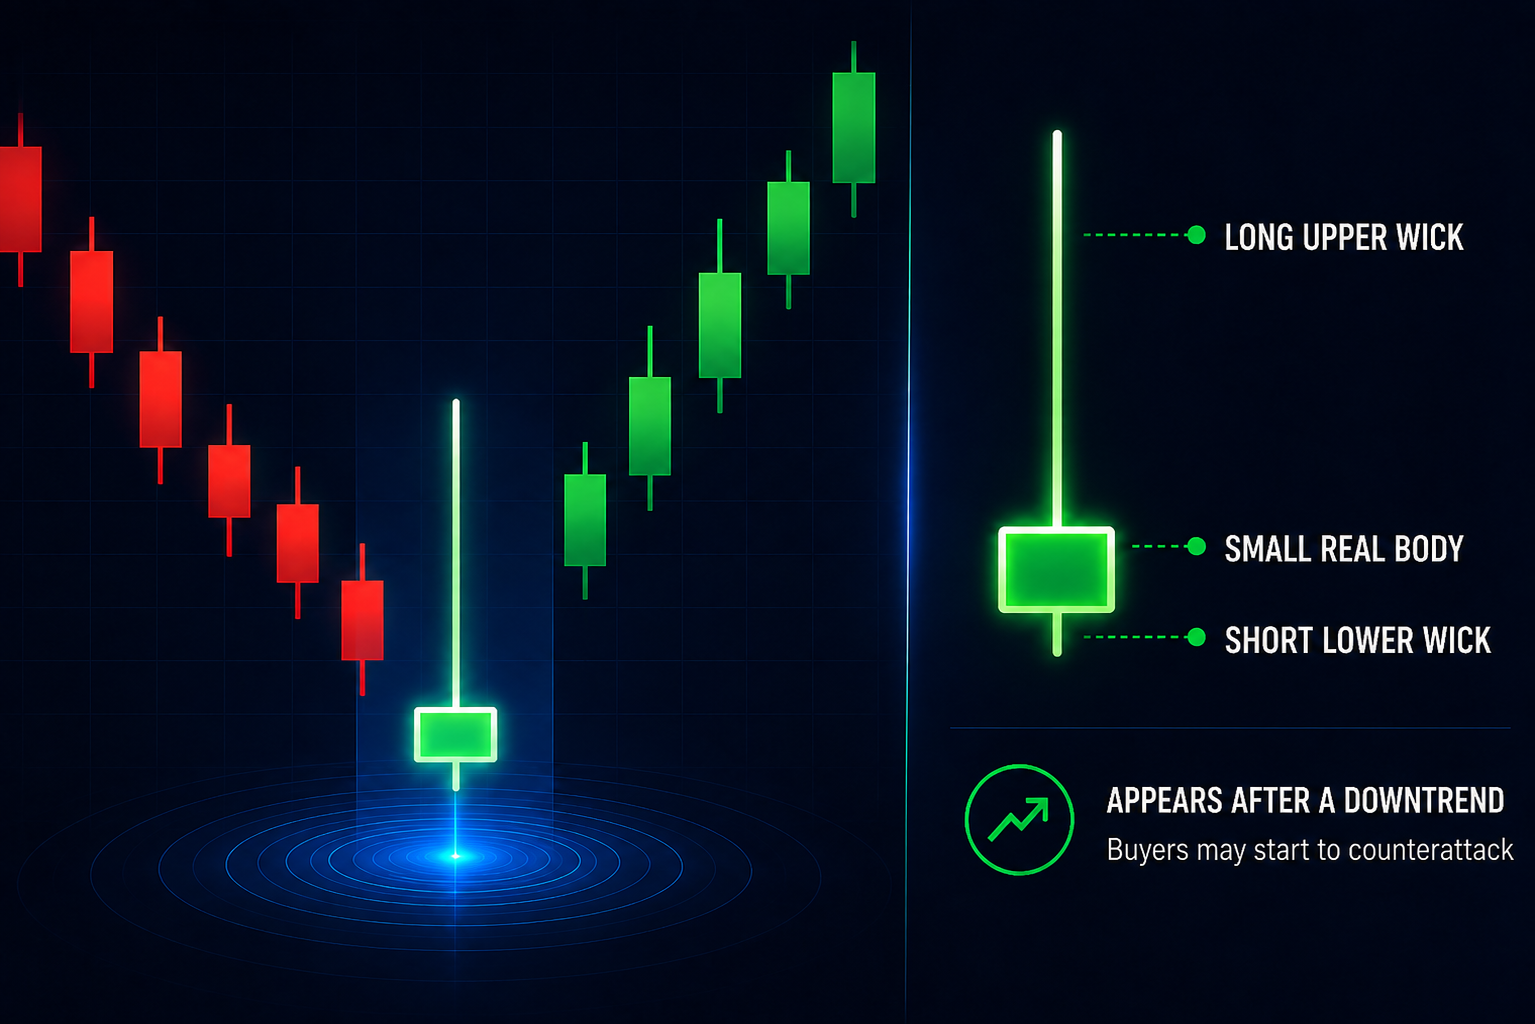
05|Inverted Hammer: Buyers Begin to Fight Back
An Inverted Hammer usually shows:
- Small real body
- Long upper wick
- Short lower wick
If it appears after a downtrend, it indicates that prices were pushed higher during the period, suggesting buyers attempted to fight back but failed to fully hold those higher levels.
This may indicate:
The previously dominant selling pressure is being challenged.
Like the Hammer pattern, an Inverted Hammer should be evaluated together with subsequent price action rather than used as an independent trading signal.
06|Engulfing Pattern: A Shift in Buyer and Seller Strength
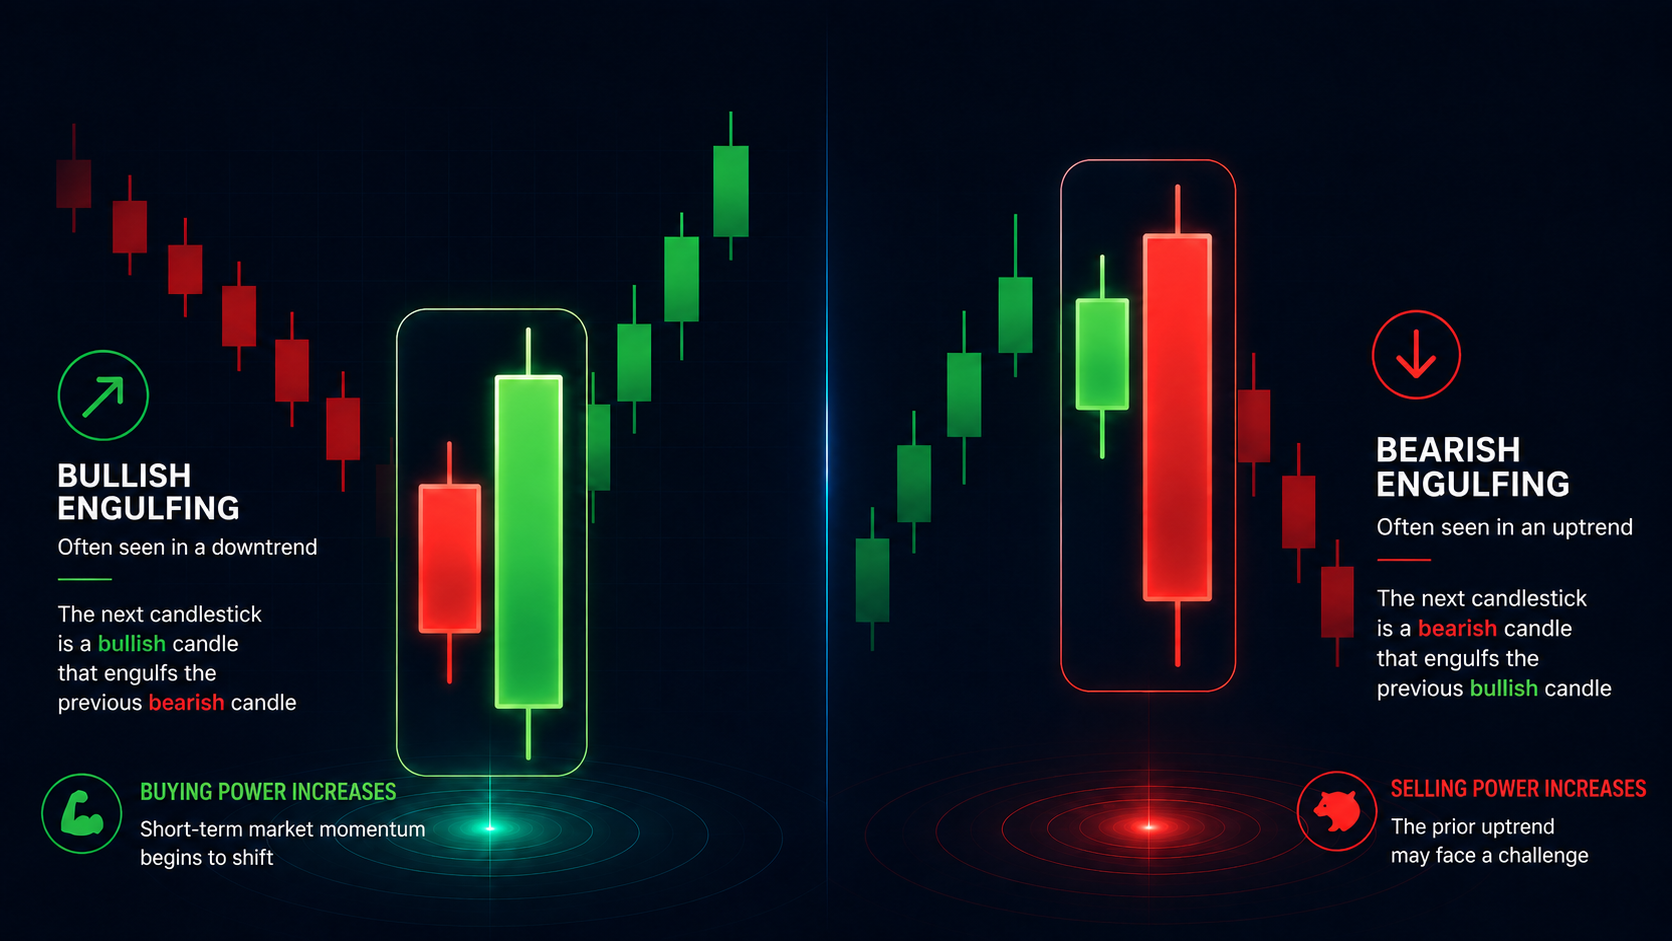
An Engulfing pattern usually consists of two consecutive candlesticks.
Bullish Engulfing
Commonly appears during a downtrend.
The body of the following bullish candle completely covers the body of the previous bearish candle.
It may indicate:
Buying pressure is increasing, and short-term market dynamics are beginning to change.
Bearish Engulfing
Commonly appears during an uptrend.
The body of the following bearish candle completely covers the body of the previous bullish candle.
It may indicate:
Selling pressure is increasing, and the existing upward momentum is being challenged.
The Engulfing pattern reflects changes in buying and selling forces across two consecutive periods, making it a commonly observed price action pattern.
07|Why Shouldn’t You Only Look at One Candlestick?
This is one of the most important lessons for beginners learning candlestick analysis:
Candlestick patterns provide market information, not guaranteed trading answers.
The same Hammer pattern can have very different meanings depending on where it appears.
A Hammer forming near an important support level after a prolonged decline may carry different implications compared with one appearing in the middle of a sideways market.
Therefore, when analyzing candlesticks, it is recommended to consider:
① Trend
Is the current market trending upward, downward, or moving sideways?
② Position
Does the pattern appear near previous highs, lows, support levels, or resistance levels?
③ Trading Volume
Does volume change significantly when the pattern appears?
④ Confirmation
Do subsequent candlesticks further support the signal?
08|How Should Beginners Read Candlesticks? Remember These 4 Steps
You do not need to memorize dozens of candlestick patterns at the beginning.
When you see a candlestick, observe it in the following order:
STEP 1|Look at the Body
Is the body long or short? Which direction is the overall price moving?
STEP 2|Look at the Wick
Are there noticeable long upper or lower wicks? Where did the price encounter opposing pressure?
STEP 3|Look at the Position
Does the pattern appear during an uptrend, downtrend, or near an important price area?
STEP 4|Wait for Confirmation
Observe whether subsequent candlesticks continue or confirm the current signal.
One-Minute Summary
The key to learning candlesticks is not memorizing every pattern, but understanding the market behavior behind them.
Remember:
Body → Direction
Wick → Market Battle
Position → Context
Follow-up → Confirmation
Most importantly:
A single candle ≠ a confirmed trading signal.
A candlestick is like the “language” of the market.
Once you understand how buyers and sellers leave traces through price movements, you can read price charts in a more logical way.
This article is for trading education and information sharing only and does not constitute investment advice. Trading stocks, digital assets, and derivatives involves risks. Please make decisions carefully based on your own circumstances.